NOAA
Ground-truthing Satellite Imagery with Drifting Buoy Data
Ground-truthing ... is it even a word? The last installment of a five-part series analyzes how scientists collect sea surface temperature data. Scholars use government websites to compare temperature data collected directly from buoys...
Curated OER
Ocean Exploration: How Doea you Data Grow? (Grades 7-8)
Students explore fieldwork. In this seventh or eighth grade mathematics lesson plan, students watch a video on data collection in the field. Students use fieldwork to gather data about their school environment. ...
Curated OER
Weather, Data, Graphs and Maps
Students collect data on the weather, graph and analyze it. In this algebra lesson plan, students interpret maps and are able to better plan their days based on the weather reading. They make predictions based on the type of clouds they...
Curated OER
The Way to Better Grades!
Pupils collect and analyze data. In this statistics lesson, learners create a scatter plot from their collected data. They use, tables and graphs to analyze the data and mae decisions.
Curated OER
Data and Scientific Graphs
Learners conduct experiments and graph their data. In this statistics lesson, students collect data and graph it on a coordinate plane. They analyze the data looking for patterns and they discuss their findings with the class.
Radford University
Survey Activity
It's time to take a survey. After looking at an example of a survey on lunch preferences, groups design their own surveys. They consider the sample size and sampling technique, then conduct the surveys. As a final activity, they create...
Radford University
A Change in the Weather
Explore the power of mathematics through this two-week statistics unit. Pupils learn about several climate-related issues and complete surveys that communicate their perceptions. They graph both univariate and bivariate data and use...
EngageNY
Nonlinear Motion
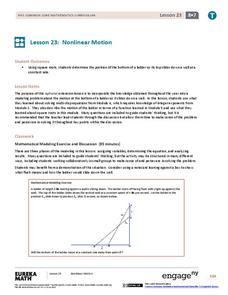
Investigate nonlinear motion through an analysis using the Pythagorean Theorem. Pupils combine their algebraic and geometric skills in the 24th lesson of this 25-part module. Using the Pythagorean Theorem, scholars collect data on the...
Curated OER
Can You Measure Up?
Here is a well-designed lesson on common standards of measurement for your young mathematicians. In it, learners calculate measurements in standard and non-standard units. They make predictions, record data, and construct and design...
Curated OER
Beginning Modeling for Linear and Quadratic Data
Students create models to represent both linear and quadratic equations. In this algebra lesson, students collect data from the real world and analyze it. They graph and differentiate between the two types.
Virginia Department of Education
Average Atomic Masses
Facilitate learning by using small objects to teach the principles of atomic mass in your science class. Pupils determine the average mass of varying beans as they perform a series of competitive experiments. They gather data and...
Curated OER
Collect Data Using a Transect Line
Learners learn about transect lines through a study of marine debris. In this marine debris instructional activity, students calculate the items on a transect line and graph them. Learners complete a category worksheet.
Curated OER
Solar Kit Lesson #8 - Positioning Solar Panels II: Explorations with Stationary Panels
This lesson is preparation-intensive, but well worth the investment. You will construct five or six portable testing stations with which lab groups will gather data on the best position for collecting sunlight with a solar panel. This is...
Odyssey of the Mind
Odyssey of the Mind Curriculum Activity: HEALTHY HUMOR
This lesson is hilarious! To understand how to investigate a topic, collect data, and evaluate the results, learners research the effects of laughter on health. Each group is assigned a research task, which they will turn into...
Curated OER
Gathering Statistics for Research
Learners gather statistics to include in their research. For this statistics lesson, students investigate how to incorporate statistics into research and other readings besides math. They collect data based on other topics, analyze the...
NASA
The Invisible Sun: How Hot Is It?
It's getting hot in here! The first in a series of six lessons has learners model nuclear fusion with a simple lab investigation. Groups collect data and analyze results, comparing their models to the actual process along the way.
Curated OER
Egg Hunt
Young scholars make detailed qualitative and quantitative observations. They are introduced to the process of developing repeatable procedures. Students practice collecting data. They review measurement skills. Young scholars become...
Curated OER
Probability and Expected Value
Students collect data and analyze it. In this statistics lesson, students make predictions using different outcomes of trials.
Intel
Forensics: Get a Clue
Although the methods are all scientific, forensic science was started by police officers rather than scientists, who relied on observation and common sense. Young detectives use many tools to solve crimes around the school in a...
Curated OER
Analytical Problem Solving
High schoolers explore about propagation of error in calculations using experimental data. They develop their weighing and pipetting techniques. Students explore the following terms: Standard deviation and relative standard deviatin....
Curated OER
Spaghetti Graphs
Young scholars work in pairs to test the strength of spaghetti strands. They collect and graph data to determine a line of best fit. Students create a linear equation to interpret their data. Based on the data collected, young scholars...
Curated OER
Earthquake Epicenter
Learners use chart data to determine the location of the epicenter of an earthquake. This task assesses students' abilities to generalize and infer, organize data, interpret data, and apply mathematical concepts.
Statistics Education Web
Double Stuffed?
True or false — Double Stuf Oreos always contain twice as much cream as regular Oreos. Scholars first measure the masses of the filling in regular Oreos and Double Stuf Oreos to generate a class set of data. They use hypothesis testing...
PBS
Terrific Trees
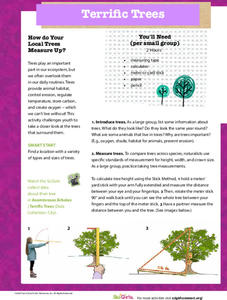
Engage in a shady activity to practice measurement techniques. Classes venture outside to collect measurements of various trees, using different strategies to measure the height, trunk circumference, width, and crown size. Then they...


