Curated OER
Compound Inequalities and Graphing
Put geometry skills to the test! Learners solve compound inequalities and then graph the inequalities on a coordinate plane using their geometric skills. They identify the slope and y-intercept in order to graph correctly. I like this...
Curated OER
Systems of Equations and Inequalities
This is a comprehensive lesson on creating and solving equations and systems of equations and inequalities. Problems range from basic linear equations to more complex systems of equations and inequalities based on a real-world examples....
EngageNY
Solving Inequalities
Do properties of equations hold true for inequalities? Teach solving inequalities through the theme of properties. Your class discovers that the multiplication property of equality doesn't hold true for inequalities when multiplying by a...
EngageNY
Solving and Graphing Inequalities Joined by “And” or “Or”
Guide your class through the intricacies of solving compound inequalities with a resource that compares solutions of an equation, less than inequality, and greater than inequality. Once pupils understand the differences, the...
02 x 02 Worksheets
Absolute Value Equations and Inequalities
Demonstrate the meaning of an absolute inequality using three different methods. Here, scholars explore absolute value inequalities through graphing, number line distance, and compound inequalities. Pupils complete various activities to...
EngageNY
Solution Sets to Inequalities with Two Variables
What better way to learn graphing inequalities than through discovering your own method! Class members use a discovery approach to finding solutions to inequalities by following steps that lead them through the process and...
Curated OER
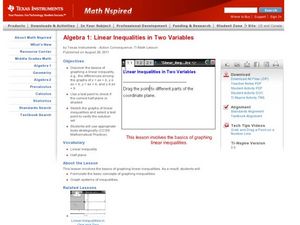
Linear Inequalities in Two Variables
Graph and solve linear equations in two variables. The class relates the concepts of linear equations to the real world.
EngageNY
Solution Sets of Two or More Equations (or Inequalities) Joined by “And” or “Or”
English and math have more in common than you think. Make a connection between a compound sentence and a compound inequality with an activity that teaches learners the difference between an "and" and "or" inequality through solutions...
Curated OER
Graphing Systems of Inequalities
Solve equations and graph systems of inequalities. Designed as a lesson to reinforce these concepts, learners revisit shading and boundaries along with solving linear inequalities.
Curated OER
Relations and Graphs
Here is a simple, yet clever lesson on how to teach the important concepts of greater than, less than, and equal to. Pupils write their names down on grid paper - one letter per box. They compare their names and find a name that is...
Curated OER
Simple Inequalities
Students solve inequalities. In this inequalities lesson, students evaluate simple inequalities. They examine vocabulary words. Students participate in breath holding activities and write inequalities to represent the activity. In teams,...
Curated OER
Solving multi-step inequalities and solving systems by elimination
Students solve multi-step equations and apply the process of elimination. In this algebra lesson, students solve linear inequalities and equations using linear combination and evaluation. They graph their results on a number line...
Illustrative Mathematics
Telling a Story With Graphs
Turn your algebra learners into meteorologists. Students are given three graphs that contain information about the weather in Santa Rosa, California during the month of February, 2012. Graph one shows temperatures, graph two displays the...
Curated OER
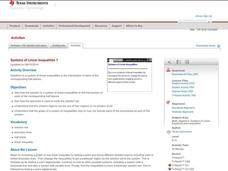
Systems of Linear Inequalities
The class solves systems of linear inequalities. They graph lines and identify the point of intersection.They graph lines and identify the boundary that represent the solution and solution set.
Mathematics Vision Project
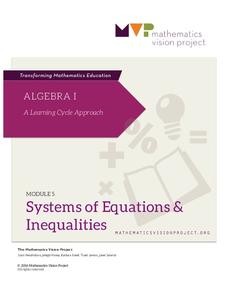
Module 5: Systems of Equations and Inequalities
Systems of equations and inequalities model contextual situations. A set of 12 lessons build a solid understanding of writing and solving systems of equations and inequalities using a variety of methods. The module is the fifth in a...
Shodor Education Foundation
Linear Inequalities
An interactive lesson helps individuals learn to graph inequalities in two variables. Scholars can adjust the interactive to present the inequalities in standard or slope-intercept form.
EngageNY
Finding Systems of Inequalities That Describe Triangular and Rectangular Regions
How do you build a polygon from an inequality? An engaging lesson plan challenges pupils to do just that. Building from the previous lesson plan in this series, learners write systems of inequalities to model rectangles, triangles,...
Balanced Assessment
Toilet Graph
Mathematics can model just about anything—so why not simulate the height of water in a toilet bowl? The lesson asks pupils to create a graphical model to describe the relationship of the height of the water as it empties and fills again....
Curated OER
Linear Inequalities in One and Two Variables: Rays and Half Planes
Define rays and half planes, including the concepts of boundary lines and prerequisite knowledge of coordinate planes. Given linear inequalities in one and two variables, your class will compare the differences. They will also graph...
EngageNY
Interpreting Quadratic Functions from Graphs and Tables
Seeing functions in nature is a beautiful part of mathematics by analyzing the motion of a dolphin over time. Then take a look at the value of a stock and maximize the profit of a new toy. Explore the application of quadratics by...
Curated OER
Graphing Inequalities
Students solve inequalities and graph. In this algebra lesson, students rewrite inequalities in the slope intercept form and graph using the slope and intercept. They shade the correct side of the line using greater than or less than as...
Curated OER
Graphing Inequalities in One Variable
Students graph inequalities on a number line. In this algebra instructional activity, students solve linear and compound inequalities and graph them on a number line. They write an inequality given the number line with the solution...
Curated OER
Inequalities 7.3
Graph inequalities and discuss the difference in their slopes. Learners observe rate of change as they compare linear, quadratic, and cubic functions.
Curated OER
Two-Variable Linear Inequalities
Here is an engaging instructional activity on solving equations with two variables. Have the class rewrite linear equations in the slope intercept form, y=mx + b. They graph the lines using the slope and y-intercepts.
Other popular searches
- Graphing Linear Inequalities
- Graphing Inequalities
- Math Graphing Inequalities
- Graphing Compound Inequalities
- Algebra Graphing Inequalities


