Curated OER
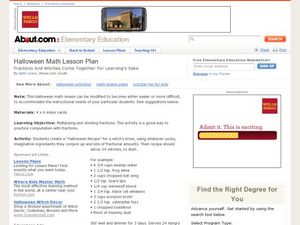
Halloween Math Lesson Plan
Students practice their multiplication and division by creating a Witches Brew. In this holiday math lesson, students utilize Halloween style ingredients to create a fun edible treat for themselves. Students practice their...
Curated OER
Call it "Macaroni"
Who knew there were so many fun educational opportunities featuring pasta? Scholars read a brief informational text about the history of pasta (note that "macaroni" is spelled two different ways, so address this if kids are reading...
Curated OER
Have You Looked Outside? Lesson #5- Graphing Weather Conditions
First graders study daily weather changes. For this weather and graphing lesson, 1st graders chart the daily weather for a month using stickers or weather symbols. They graph the weekly weather so that at the end of the month students...
EngageNY
Proofs of Laws of Exponents
Apply pupil understanding of exponent properties to prove the relationships. In the sixth activity of the series, individuals are expected to prove relationships using mathematical statements and reasoning.
Curated OER
Ornithology and Real World Science
Double click that mouse because you just found an amazing lesson! This cross-curricular Ornithology lesson incorporates literature, writing, reading informational text, data collection, scientific inquiry, Internet research, art, and...
Math Solutions
Factor Game
Learning about factors and multiples is all fun and games with this simple math activity. The lesson begins with the teacher and class playing the Factor Game together as students figure out the rules and uncover key...
Shodor Education Foundation
Multiple Linear Regression
You'll have no regrets when you use the perfect lesson to teach regression! An interactive resource has individuals manipulate the slope and y-intercept of a line to match a set of data. Learners practice data sets with both positive and...
Curated OER
Lessons for Atlatl Users with Some Experience-Grade 6
Sixth graders experiment with an atlatl and dart. In this sixth grade data management mathematics lesson plan, 6th graders explore and determine the most suitable methods of displaying data collected from their experimentation with...
Illustrative Mathematics
Weather Graph Data
Teaching young mathematicians about collecting and analyzing data allows for a variety of fun and engaging activities. Here, children observe the weather every day for a month, recording their observations in the form of a bar graph....
Mathematics Vision Project
Module 9: Statistics
All disciplines use data! A seven-lesson unit teaches learners the basics of analyzing all types of data. The unit begins with a study of the shape of data displays and the analysis of a normal distribution. Later lessons discuss the...
Mathematics Vision Project
Module 1: Functions and Their Inverses
Undo a function to create a new one. The inverse of a function does just that. An inquiry-based lesson examines the result of reversing the variables of a function, beginning with linear patterns and advancing to quadratic and...
Curated OER
Fanning The Spark: Fostering Your Students' Creativity
Here is a packet of lessons which are designed to help you to foster your pupils' creativity. The lessons are designed to develop their fluency, flexibility, originality, and elaboration on ideas. The are built around field trips to a...
Curated OER
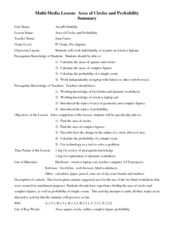
Area of Circles and Probability
Students investigate the area of squares and circles. In this geometry lesson, students calculate the area and probability of simple events. They work on a laptop using Safari.
Shodor Education Foundation
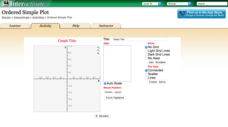
Ordered Simple Plot
Open your imagination to make algebra-inspired creations. An interactive lesson has scholars graph images from a set of parameters. Users can practice minimum values, maximum values, and scale as well as key features.
Shodor Education Foundation
Linear Inequalities
An interactive lesson helps individuals learn to graph inequalities in two variables. Scholars can adjust the interactive to present the inequalities in standard or slope-intercept form.
Shodor Education Foundation
Multi-Function Data Flyer
Explore different types of functions using an interactive lesson. Learners enter functions and view the accompanying graphs. They can choose to show key features or adjust the scale of the graph.
Curated OER
Hickory Dickory Doc Tell Time
Students discover time keeping by reading clocks. In this time-telling instructional activity, students read the story Hickory Dickory Dock, and discuss the measurements of time we use. Students complete worksheets in which...
Curated OER
Lotto or Life: What Are the Chances?
Though the website does not seem to have the mentioned video, a reding and lottery style games simulate the chances of finding intelligent life somewhere other than Earth. Without the video, this lesson is short, but it can be a useful...
Curated OER
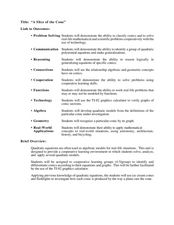
"A Slice of the Cone"
Here is a set of lessons that explore conics in a number of different ways. Starting with modeling how a conic is produced by the way a plane cuts the cone, to solving complex word problems, algebra learners progress through a series of...
PricewaterhouseCoopers
Credit and Debt: Decisions, Decisions...
Borrowing money seems like a great idea until you are in over your head. High schoolers learn the benefits and risks associated with credit and how to be a responsible borrower. More than just credit cards, they...
PricewaterhouseCoopers
Credit and Debt: Understanding Credit Reports and Managing Debt
Credit cards are tempting to use right out of high school. Teach your upperclassmen the benefits and challenges of credit and how it can affect their future. The lesson covers credit scores and ways to strengthen credit if...
PricewaterhouseCoopers
The Stock Market
Keep or sell? Young learners simulate as buyers in the stock market while learning about the benefits and important factors to know when purchasing. The thorough resource allows for observation of case studies and provides...
Curated OER
Application of Graph Theory
Students investigate different online tutorials as they study graphing. In this graphing lesson, students apply the concept of graphs cross curricular and use it to make predictions. They define the purpose and theories behind graphs.
Shodor Education Foundation
Incline
Study velocity while examining graphical representations. As scholars work with the animation, they discover the effect the height of an incline has on the velocity of the biker. They make conclusions about the slope of the...
