Alabama Learning Exchange
Straight Line Motion
Students examine gravity, mass, and friction. In this speed and motion instructional activity, students investigate how straight line motion is impacted by gravity, mass, and fiction as they participate in a hands-on activity.
Curated OER
Making a Pinhole Camera
Students are introduced to the basic straight line pattern of travel that light takes. A cereal box and wax paper provide the pinhole camera that captures the light's inverted image. Shifting this pattern provides additional challenges.
EngageNY
Informally Fitting a Line
Discover how trend lines can be useful in understanding relationships between variables with a lesson that covers how to informally fit a trend line to model a relationship given in a scatter plot. Scholars use the trend line to make...
Curated OER
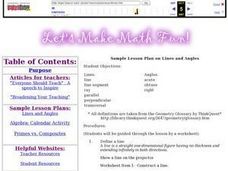
Sample Lesson Plan on Lines and Angles
Student complete worksheet using the definitions of lines and angle vocabulary. They define the word and follow a direction given on the worksheet such "construct a line." They complete an online tutorial on how to measure angles using a...
EngageNY
Determining the Equation of a Line Fit to Data
What makes a good best-fit line? In the 10th part of a 16-part module, scholars learn how to analyze trend lines to choose the best fit, and to write equations for best-fit lines to make predictions.
EngageNY
The Distance from a Point to a Line
What is the fastest way to get from point A to line l? A straight perpendicular line! Learners use what they have learned in the previous lessons in this series and develop a formula for finding the shortest distance from a point to a...
CK-12 Foundation
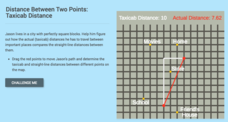
Distance Between Two Points: Taxicab Distance
Apply geometry to find the distance as the crow flies. An engaging lesson compares the distance a car must drive to the straight line distance between two locations. Scholars must manipulate a simulation, note the change in distances,...
Curated OER
Interpreting and Displaying Sets of Data
Students explore the concept of interpreting data. In this interpreting data lesson, students make a line plot of themselves according to the number of cubes they can hold in their hand. Students create their own data to graph and...
Radford University
Can I Create a Line/Curve of Best Fit to Model Water Drainage?
Learners collect data on the amount of water left in a bottle over time. They graph the data to determine whether the scatter plot shows a curved or straight relationship. Group members then determine an equation for the curve of best...
Curated OER
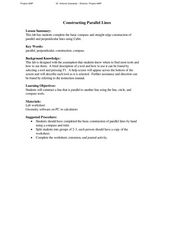
Constructing Parallel Lines
Students construct parallel lines using a protractor and a straightedge. In this geometry lesson, students identify the properties of parallel lines. They use Cabri to graph and observe the lines.
Curated OER
Line, Shape, and Texture
Students are introduced to various types of artwork by various artists. In groups, they identify the lines and shapes used by the artist to create a specific texture. They write a paper of their observations and discuss them as a class.
Curated OER
Dividing Line Segments into n Congruent Parts
Young scholars identify lines, and line segments. In this geometry lesson, students divide line segments into equal congruent parts. They complete a laboratory activity dealing with lines and segments.
Curated OER
Straight Line Motion in Two Parts
Students describe and quantify the motion of toy cars. In this motion lesson plan, students observe a battery powered toy car on a flat surface and a standard toy car on a sloped surface. They write their observations, measure average...
Curated OER
Joseph Stella Art: Line Designs
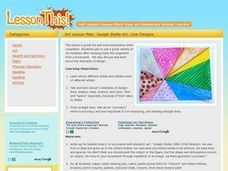
Students discover the focal point in pictures and create their own images using lines and space. In this art analysis lesson, students create a black dot on a white paper which becomes a focal point for the lines the student will paint...
Curated OER
Am I Straight
Identify the slope of a linear equation in this algebra lesson. Middle schoolers graph linear equations using slopes and intercepts. They identify the slope as being positive, negative, no slope, or undefined.
Curated OER
Investigating Correlation
High schoolers investigate different types of correlation in this statistics instructional activity. They identify positive, negative and no correlation as it relates to their data. They then find the line of best fit for the plotted data.
Curated OER
New Zealand South Island Fault Model
Students explore world geography by creating a scientific model in class. In this New Zealand lesson, students research the geography and fault lines of the South Island in New Zealand. Students utilize foam board, arts and crafts and a...
Curated OER
Slopes and Lines
Students identify the slopes of a line. In this algebra instructional activity, students calculate the slope and intercept of a line. They graph their lines using a TI calculator.
American Statistical Association
You and Michael
Investigate the relationship between height and arm span. Young statisticians measure the heights and arm spans of each class member and create a scatter plot using the data. They draw a line of best fit and use its slope to explain the...
American Statistical Association
Scatter It! (Using Census Results to Help Predict Melissa’s Height)
Pupils use the provided census data to guess the future height of a child. They organize and plot the data, solve for the line of best fit, and determine the likely height and range for a specific age.
CK-12 Foundation
Midpoint and Segment Bisectors: Midpoint Map
Discover how to find a midpoint with a conceptual exploration. Scholars manipulate a point to determine the location of a midpoint on a straight line distance between two locations. Later questions extend to determine the location of...
NASA
Photons in the Radiative Zone: Which Way Is Out? An A-Maz-ing Model
Can you move like a photon? Young scholars use a maze to reproduce the straight line motion of a photon. The second in a six-part series of lessons on the sun has learners measure angle of incidence and refraction to determine the path...
101 Questions
Rotonda West, FL
The shortest distance from point A to point B is a straight line—or is it? Young scholars determine the shortest route either along a circular path or through the center of the circle. Learners gain a unique perspective on arc length and...
Concord Consortium
In Oz We Tryst
The shortest distance from point A to point B is a straight line, but measuring distance gets more complicated when there are three points! Given the location of three friends, individuals determine the best point for all three friends...
Other popular searches
- Straight Line Graphs
- Gradient Straight Line Graph
- Gradient Straight Line
- Tracing Straight Lines
- Straight Line Depreciation
- Vectors Motion Straight Line
- Drawing Straight Line Graphs
- Straight Line Motion
- Curves Using Straight Lines
- Cutting a Straight Line
- Straight Line Equations
- Graph Straight Lines


