Curated OER
Counting
Second graders comprehend how to use two different kinds of graphs. They complete a worksheet with the help of the teacher and a bag of jellybeans and then another worksheet without the direction of the teacher. Students listen as the...
Curated OER
Graphing Our Favorite Candy Bars
Students use ClarisWorks to graph class' favorite candy bars on a bar graph.
Curated OER
Introduction to Science
Seventh graders investigate scientific methods to solve problems. They demonstrate creating data tables and graphs. They study the role of a scientist and the importance of safety in a science lab. They distinguish between an...
Curated OER
Making Money and Spreading the Flu!
Paper folding, flu spreading in a school, bacteria growth, and continuously compounded interest all provide excellent models to study exponential functions. This is a comprehensive resource that looks at many different aspects of these...
Curated OER
Fast Food: You Can Choose!
Students research the nutritional value of fast food. They assess which fast foods are best and worst to eat. They organize their data into tables and graphs and explain their findings to other students.
Virginia Department of Education
How Much is that Tune?
Tune in for savings! Scholars investigate pricing schemes for two different online music download sites. After comparing the two, they determine the numbers of songs for which each site would be cheaper.
Curated OER
Taxi!
Your young taxi drivers evaluate and articulate the reasoning behind statements in a conceptual task involving linear data. The given data table of distances traveled and the resulting fare in dollars is used by learners to explore...
Curated OER
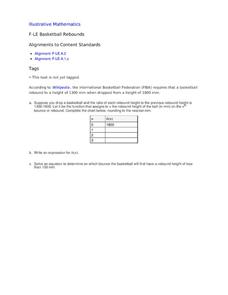
Basketball Rebounds
Your young basketball players will build a table and develop a general formula for a decaying exponential scenario involving the rebound distance of a bouncing ball. Using a CBR and graphing calculator can make this even more hands-on...
Illustrative Mathematics
Paying the Rent
Learning how a bank account works is a useful tool. The exercise in the resource is to deduct rent from a checking account and create an equation from a description. Participants then graph the balance of the bank account versus months...
Curated OER
Introduction to Graphical Representation of Data Sets in Connection with Nuclear Decay
Students record data, make observations, and share in experimentation and discussion of numerical experiments.
Curated OER
Kansas Foods A Data and Probability Investigation
Students study a number of food products and anticipate which are derived from Kansas crops. They make a list of words associated with the food stuffs and graph the results.
Curated OER
The Winner Is...
Young scholars create graph from previously collected data using "The Graph Club."
Curated OER
Weather Report Chart
Students complete a weather report chart after studying weather patterns for a period of time. In this weather report instructional activity, students measure temperature, precipitation, cloud cover, wind speed, and wind direction for a...
Curated OER
Virtual Field Trip / Route, Mileage and Gasoline Cost Graphs
Pupils use a spreadsheet program to graph and compare milage, gasoline costs and travel time for two travel routes in their virtual field trip in Michigan. They determine the most economical route based on the graphs and calculations.
Curated OER
Bounce Back Ball
Fifth graders work in teams of four to measure the rebound heights of a tennis ball dropped from four different heights. They investigate with the bouncing balls to measure changes in the type of energy they possess.
Curated OER
Geography And The Gulf War
Students develop maps, tables, graphs, charts, and diagrams to depict the geographic implications of current world events, and analyze major human conflicts to determine the role of physical and cultural geographic features in the...
Curated OER
Yummy Apples!
Students discuss apples and how they are grown. They listen as the teacher reads "Apples," by Gail Gibbons. Students discuss the story. They view several different types of apples and compare their characteristics. Students taste several...
Curated OER
1928 Flu
Students state the some diseases are the result of infection. They describe the risks associated with biological hazards, such as viruses. Pupils name ways that infectious disease can be prevented, controlled, or cured. Students...
Mathematics TEKS Toolkit
Grade 6: Exploring c/d = pi
Introduce your math class to the perimeter of a circle. Teach them that pi describes the relationship between the circumference and the diameter. As a hands-on investigation, pairs or small groups use string to compare these two values...
SRI International
The Water Crisis
Water, water, everywhere, right? Wrong. Learners assess their own knowledge of water availability on Earth. Then, through a reading, a teacher-led presentation, and an activity, pupils learn about the importance of available clean...
Curated OER
Marbles and Momentum
Students examine the law of conservation of momentum. In this physics lesson, students play marbles in order to compare the mass of the marble and velocities effects. Students receive directions of the marbles game and collect data while...
Curated OER
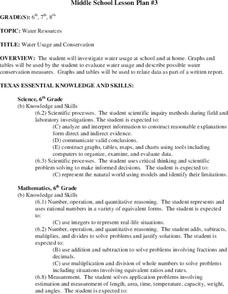
Water Usage and Conservation
Middle schoolers investigate water usage at school and at home. They use graphs and tables to evaluate water usage. Students describe possible water conservation measures. They use graphs and tables to relate data as part of a written...
Curated OER
Statistics Newscast in Math Class
Students study sports teams, gather data about the teams, and create a newscast about their data. In this sports analysis lesson, students research two teams and define their statistical data. Students compare the two teams, make...
Curated OER
Water Quality in the Greenhills Stream
Seventh graders conduct year long study of water quality over different seasons using variety of probes, including D.O., pH, conductivity and temperature, that are attached to portable technology. Students select three data points in...


