Curated OER
Walk-A-Thon
Students graph linear http://www.lessonplanet.com/review?id=180542equations. In this problem solving lesson, students calculate slope and plot ordered pairs on a coordinate grid. Using a real-life example of a walk-a-thon, students...
Space Awareness
Greenhouse Effect
A greenhouse provides additional warmth and protection to the plants inside, but what if the greenhouse gets too hot? Pupils discuss and experiment with the difference between natural and anthropogenic greenhouse effect. They measure the...
Curated OER
Our Desert Backyard
Young scholars make observations of their own backyard. In this environment lesson, students keep records of the plants and animals they see in their home or school yard. Young scholars make notes of how the weather and environment...
Curated OER
Weather Report Chart
Students complete a weather report chart after studying weather patterns for a period of time. In this weather report instructional activity, students measure temperature, precipitation, cloud cover, wind speed, and wind direction for a...
NASA
Development of a Model: Analyzing Elemental Abundance
How do scientists identify which elements originate from meteorites? Scholars learn about a sample of material found in a remote location, analyzing the sample to determine if it might be from Earth or not. They study elements, isotopes,...
Curated OER
Unit 2: Lesson 7
Students are introduced to spreadsheets. They conduct a survey of television viewing time of different shows based on different age categories. Students work in small groups. They collect, data and interpret the data from a survey.
Curated OER
Conducting a Scientific Investigation
Learners investigate a possible health problem in the local school district through inquiry into attendance records, activities, maps, graphs, and data tables. The simulation continues as solutions for the problem are sought.
Curated OER
Graphing the Elephant Seal Population Data
Students are able to graph data that they generated in the elephant seal exercise using proper format and labeling. They are able to interpret the graphs they created and make A) conclusions, and B) predictions based on that graph.
Curated OER
Lesson Plan: The Net Neutrality Debate
Should Internet users who send data-heavy content pay higher fees than those who are involved in activities, like sending an email, that have less content? This question is at the heart of the Net Neutrality debate. After watching a PBS...
Curated OER
Zebra Mussel Population Simulation
Students are taught how to format and enter data into an Excel spreadsheet. They make a graph, and interpret graphed data. Students discuss the possible impacts of zebra mussels on the Hudson river. They graph zebra mussel data.
Curated OER
How Times Have Changed
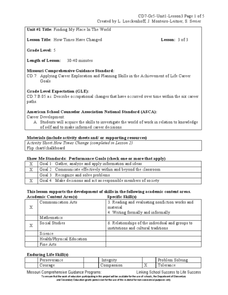
Fifth graders work in small groups to compile job changes. They use data from the list of changes that the group generated together. Students analyze the data to determine: categories of changes, patterns or trends of changes, and future...
Curated OER
I'm Out of Here
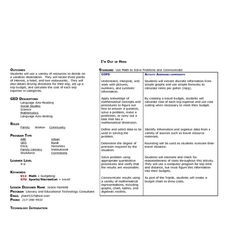
Young scholars create a travel budget. In this budget lesson, students research vacation destinations. Working independently, young scholars research destinations on the Internet and construct a budget for the vacation. Resources provided.
Curated OER
Farm Stories, Animal Webbing, Favorite Farm Animal Graph
Students brainstorm animals they would expect to see on a farm. They save these on a Kidspiration web. Students watch or read a farm story. They discuss the characters. Students vote for their favorite farm animal and crate a graph using...
Curated OER
Maryland’s Chesapeake Bay Landscape Long Ago and Today
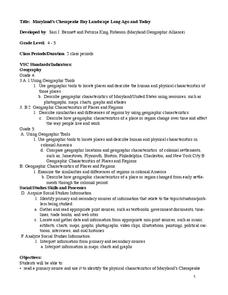
Combine a fantastic review of primary source analysis with a study of Captain John Smith's influence on the Chesapeake Bay region in the seventeenth century. Your young historians will use images, a primary source excerpt, and maps...
Population Connection
The Peopling of Our Planet
How many people live on the planet, anyway? The first resource in a six-part series covers the topic of the world population. Scholars work in groups to conduct research and make population posters after learning about the global...
Curated OER
What's Your Line?
Fifth graders collect temperature readings over a period of time, enter the information into a spreadsheet and choose the appropriate graph to display the results.
Curated OER
Math: Skyscraper Comparison
Students examine skyscrapers by conducting Internet research and by creating and interpreting graphs. After reading the book, "Skyscraper," they discuss reasons why the structures are built. Once they have researched the tallest...
Curated OER
Money Circulation: A Story of Trade and Commerce
Students are introduced to the meaning, symbolism, and value of the quarter. They determine the percentage of total monetary value held in quarters and graph the results. Students infer about the U.S. Mint's distrubution of coins. They...
Curated OER
Just Graph It!
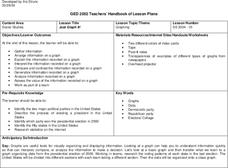
High schoolers research presidential election voting results, and organize and interpret data on class graphs.
Federal Reserve Bank
Measuring the Great Depression
Young historians examine the cost of goods and services through the Consumer Price Index (CPI), output measured by Gross Domestic Product (GDP), and unemployment measured by the unemployment rate to gain an understanding of the economic...
Curated OER
Different Perspectives of Oregon's Forest Economic Geography
Students map data on employment in wood products manufacturing in Oregon counties. In this Oregon forest instructional activity, students discover the percentage of people employed in the forest manufacturing industry. Students create a...
Global Change
Impact of Climate Change on the Desert Pupfish
A fish that lives in the desert? You and your class can meet the desert pupfish as they examine its habitat, the role humans play in diminishing water supplies, and how climate change might impact this fishy friend. There are four short...
Curated OER
Water Usage and Conservation
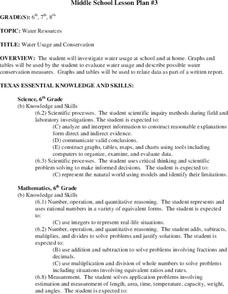
Middle schoolers investigate water usage at school and at home. They use graphs and tables to evaluate water usage. Students describe possible water conservation measures. They use graphs and tables to relate data as part of a written...
Curated OER
The Trash We Pass
Where does our garbage go? What is the difference between a recyclable and non-recyclable item? Pose these important, but often overlooked, questions to your class and invite them to consider the lasting and damaging effects of the...


