Core Knowledge Foundation
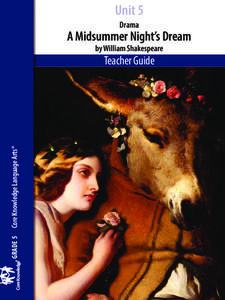
Unit 5: A Midsummer Night’s Dream
Fifth graders analyze William Shakespeare's A Midsummer Night's Dream, paying close attention to character development, plot, and dialogue. With daily reading and thoughtful discussion, scholars take pen to paper to respond to journal...
Core Knowledge Foundation
Fables and Stories Tell It Again!™ Read-Aloud Anthology
A read-aloud anthology focuses on fables. Over three weeks, first graders listen to various stories and then participate in lessons that cover story elements, including plot, characters, setting, and personification and explore...
Curated OER
Normal Probability Plot
Young scholars analyze the graph of a distribution. In this statistics lesson, students define skewed or mound shape distribution as they investigate the data behind the graph. They define and plot outlier as well as normal probability.
Curated OER
Who's got the fastest legs?
Students use a stopwatch to collect information for a scatterplot. In this fastest legs lessons, students collect data through the taking of measurements, create and find a median number. Students develop an equation and answer...
Curated OER
Problems and Their Solutions in Stories and Everyday Life
Students identify story elements. In this stories lesson, students read a story and identify the chracter, character traits, plot, setting and theme. Groups of students match problem and solution cards.
Curated OER
Math Lesson: What Do You Want to Know? - Country Statistics
Learners are able to identify the characteristics of a variety of graphs (i.e. bar graph, line graph, pie graph, scatter plot, population pyramids, etc.) They recognize how the type of data to be presented plays a role in choosing the...
Curated OER
Using Data Analysis to Review Linear Functions
Using either data provided or data that has been collected, young mathematicians graph linear functions to best fit their scatterplot. They also analyze their data and make predicitons based on the data. This lesson plan is intended as a...
Kuta Software
Points in the Coordinate Plane
Keep young mathematicians on point with this coordinate plane worksheet. From plotting ordered pairs to identifying the quadrant and coordinates of specific points, this resource covers all the basic skills students need to have when...
Shodor Education Foundation
Regression
How good is the fit? Using an interactive, classmates create a scatter plot of bivariate data and fit their own lines of best fit. The applet allows pupils to display the regression line along with the correlation coefficient. As a final...
Penguin Books
A Teacher's Guide to the Signet Classic Edition of William Shakespeare's Julius Caesar
Are the lessons of Shakespeare's Julius Caesar still applicable today? Explore themes, characterization, and plot structure with a thorough teacher's guide to the play. The resource covers the entire text and offers rigorous activities...
Curated OER
Box-and-Whisker Plots
Eighth graders measure in feet and inches and convert to explore the relationship between the converted measurements. In this measurement lesson plan, 8th graders use the whisker and box plot to represent the measurement of a cat. ...
Curated OER
Plot It
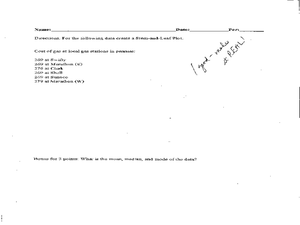
Students use a stem-and-leaf plot from a set of data to identify the range, median, and mode of their own math grades.
Curated OER
Exploring Graphs
Students are introduced to connecting graphing in a coordinate plane to making scatterplots on a graphing calculator. Working in pairs, they connect points plotted to make a sailboat and complete questions on a worksheet as well as plot...
Pennsylvania Department of Education
Multiplication Represented as Arrays
Third graders collect data about themselves and use in a line plot. In this analyzing data lesson plan, 3rd graders collect various sets of information,create a line plot and compare the data. Students complete a worksheet on their...
Curated OER
It's All in the Fluency
Take a trip to the library! Elementary schoolers visit the library and choose books to read independently. They use the cover-up method of deciphering unknown words and use timed-readings to increase fluency. They discuss characters,...
Curated OER
Plotting Coordinates on a Cartesian Plane
Students practice identifying points on a coordinate plane, creating charts, and calculating ratios. In groups, students play a "battleship" game where they determine the location of their own fleet and attempt to find the location of...
Curated OER
Stem and Leaf Plots and Circle Graphs
Students graph and plot numbers and analyze their data. In this algebra lesson, students identify the different properties of a stem and leaf plot. They decide which type of graph to use when it comes time to analyze their data.
Illustrative Mathematics
Hand Span Measures
How long is your hand span? Young mathematicians measure their hand span from pinky tip to thumb tip using a centimeter ruler. After rounding to the nearest whole centimeter, learners plot their data on a line plot.
Curated OER
A Picture Says a Thousand Words
Use photographs to trigger memories. Writers use a personal photograph as a starting point for an autobiographical writing exercise. They complete brainstorming activities that have them study their photograph before actually putting pen...
Curated OER
Drama: Learn A Lesson from the Lion
Reading is reading, whether it's for drama or English class. Boost reading fluency, accuracy, intonation, and comprehension while fostering creative acting skills. Kids read the provided tale of "The Lion and the Mouse" several times in...
Math Drills
Christmas Cartesian Art Tree
Spruce up graphing practice with an activity that has young mathematicians plot points on a coordinate plane, and then connect the points to create a Christmas tree.
Curated OER
Influence and Outliers
Using the TI-Nspire calculator, statisicians identify outliers and their effect on the least-squares regression line. In finding the line of best fit, they determine what points will affect the least squares regressions and what points...
EdHelper
George Washington's Socks by Elvira Woodruff
A solid, straightforward book report form is an excellent addition to your literature unit. Class members note the main characters, point of view, plot elements, and other important details from a story, adding their favorite part from...
CCSS Math Activities
Smarter Balanced Sample Items: 6th Grade Math – Target J
What is the best measure of central tendency? Scholars explore mean, median, mode, range, and interquartile range to understand the similarities and differences. They display data in dot plots, histograms, box plots, and more as part of...
Other popular searches
- Line Plots
- Scatter Plots
- Stem and Leaf Plots
- Box and Whisker Plots
- Box Plots
- Frequency Tables Line Plots
- Scatterplot
- Dot Plots
- Math Scatter Plots
- Line Plots Grade 3
- Stem and Leaf Plots
- Box Whisker Plots


