Bonneville
Making Observations and Recording Data for Solar Powered Water Pumping
Get pumped about an activity with water pumps. The fifth of seven installments in the Understanding Science and Engineering unit has pupils learn how to make observations, record data, and create data displays. Each group measures the...
Berkshire Museum
Camouflage!: Collecting Data and Concealing Color
Help young scholars see the important role camouflage plays in the survival of animals with a fun science lesson. Starting with an outdoor activity, children take on the role of hungry birds as they search for worms represented by...
Scholastic
Study Jams! Investigations to Collect Data
Print out the lyrics or show the karaoke video to get your scientists singing about the scientific process! Participants will warble about observations and measurements, data and physical properties. Consider sharing this resource after...
US Department of Commerce
How Does Our Class Compare?
Compare the class to the country. As a group, pupils collect data on the types of activities boys and girls do after school. Learners compare the number of girls to the number of boys for each activity. Using census data, individuals...
Mathed Up!
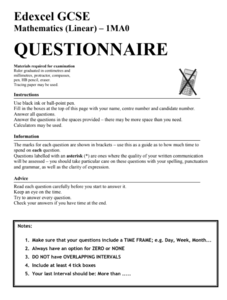
Questionnaires
Check the appropriate box. Class members determine whether a questionnaire is an appropriate one. The portion of the General Certificate of Secondary Education math assessment review requires pupils to create a valid questionnaire to...
NASA
Data Literacy Cube: Global Atmospheric Temperature Anomaly Data
Evaluate global temperature anomalies using real-world data from NASA! Climatologists analyze a data set using a literacy cube and differentiated question sheets. Team members evaluate global temperature anomaly data with basic...
EngageNY
Summarizing Bivariate Categorical Data in a Two-Way Table
Be sure to look both ways when making a two-way table. In the lesson plan, scholars learn to create two-way tables to display bivariate data. They calculate relative frequencies to answer questions of interest in the 14th part of the...
C-SPAN
Big Data and Politics
Movie selection means more than entertainment. Learners consider what information Netflix gathers to understand the concept of "big data." Resource includes clips of experts talking about corporations that harvest the details of our...
Workforce Solutions
Miniature Gulf Coast Project
Scholars show what they know about data collection and analysis with an activity that examines a smaller population of Houghton, Texas. Independently or in pairs, learners identify their research question, gather, graph, and analyze...
Discovery Education
Fuss About Dust
Dust is everywhere around us; it's unavoidable. But what exactly is dust and are certain locations dustier than others? These are the questions students try to answer in an interesting scientific investigation. Working independently or...
Equality and Human Rights Commission
Learning area 4: Learn About the Meaning of Community
Scholars examine the jobs found in their community by way of surveying. After collecting data, pupils analyze their findings and share their observations with their peers. A video sparks interest. Two posters motivate participants to...
Teach Engineering
Storing Android Accelerometer Data: App Design
There's an app for that! Pupils learn to build an app that will store data on an Android. The lesson plan introduces class members to the tiny database, TinyDB, for Android devices. A video tutorial provides an example that...
Corbett Maths
Quantitative and Qualitative Data
Classify the Big Ben of all data with a video that defines quantitative and qualitative data. Given data about Big Ben, the presenter classifies each piece based upon the definitions. In the Types of Data learning exercise, individuals...
American Statistical Association
How Long Are the Words in the Gettysburg Address?
It's 268 words, but one only needs to consider 10 of them at a time. A data collection and analysis activity has learners investigate the lengths of words in the Gettysburg Address. They first self-select a sample of 10 words and...
Curated OER
Describing Data
Your learners will practice many ways of describing data using coordinate algebra in this unit written to address many Common Core State Standards. Simple examples of different ways to organize data are shared and then practice problems...
Howard Hughes Medical Institute
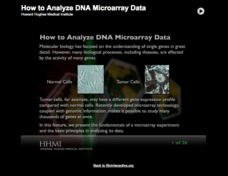
How to Analyze DNA Microarray Data
Unravel the complexities of DNA research. Analyzing DNA data can be a daunting, time-consuming task; however, as the lesson explains, an interactive importance of the research outweighs its complexities. The presentation breaks down the...
Curated OER
Button Bonanza
Collections of data represented in stem and leaf plots are organized by young statisticians as they embark some math engaging activities.
Council for Economic Education
Unemployment Data: Is the Economy Healthy?
The United States will never see a time when the unemployment rate hits 0%. Why? Scholars research economic data to uncover clues hidden in the unemployment rate at any given time. A short video as well as research activities help...
Open Oregon Educational Resources
Forest Measurements: An Applied Approach
Geometry—it's not just for the math classroom! Learners explore the field of forestry through a mathematical lens. An instructional resource explains how forest workers collect data about trees such as height, diameter, and age...
American Institutes for Research
Digital Smiles
Explore metric measurement, recording data, and creating an electronic spreadsheet displaying results with your math class. Scholars will measure the length of their smiles, record the measurements, and represent the results on an...
School Journalism
Investigative and Data Journalism – Day Two
Class members use the Investigative Reporting Article Planner they completed the first day of the unit to guide the development of an infographic that displays what they have learned about the topic they researched.
School Journalism
Investigative and Data Journalism – Day One
A free press, free to investigate and report on responsibly, compelling stories, is essential to a democracy. A 10-slide presentation details where to get ideas, how to go about an investigation, gather data, and assure the accuracy of...
Scholastic
Study Jams! Scientific Theory & Evidence
Introduce someday scientists to ideas and explanations about how the world around us works by showing this cute cartoon. In it, Mia and Sam discuss what scientific theory is, and how it is important in discovering scientific laws making...
American Statistical Association
Candy Judging
Determine the class favorite. The statistics lesson plan has pupils collect, display, and analyze data. Pairs rank four kinds of candy based on their individual preferences. Working as an entire class, learners determine a way to display...
Other popular searches
- Collecting and Recording Data
- Data Collection Techniques
- Math Lessons Data Collection
- Data Collection Activity
- Data Collection and Median
- Data Collection and Graphs
- Data Collection Projects
- Data Collection and Analysis
- Accurate Data Collection
- Data Collection Lesson Plans
- Experimental Data Collection
- Collection of Data


