Flipped Math
Graphing Polynomial Functions
Take a look in the window. Pupils watch a presentation to discover how to graph a polynomial using a graphing calculator and using the window to find the extrema. Scholars use their knowledge from previous lessons to gain a rough idea of...
EngageNY
Revisiting the Graphs of the Trigonometric Functions
Use the graphs of the trigonometric functions to set the stage to inverse functions. The activity reviews the graphs of the basic trigonometric functions and their transformations. Pupils use their knowledge of graphing functions to...
Teach Engineering
Graphing Equations on the Cartesian Plane: Slope
Slopes are not just for skiing. Instructors introduce class members to the concept of slope and teach them how to calculate the slope from a graph or from points. The lesson also includes the discussion of slopes of parallel and...
West Contra Costa Unified School District
Using Derivatives to Graph Polynomials
You can learn to graph as well as a calculator using calculus. The lesson introduces using derivatives to find critical points needed to graph polynomials. Pupils learn to find local maximums and minimums and intervals of increase and...
EngageNY
The Line Joining Two Distinct Points of the Graph y=mx+b Has Slope m
Investigate the relationship between the slope-intercept form and the slope of the graph. The lesson plan leads an investigation of the slope-intercept equation of a line and its slope. Pupils realize the slope is the same as the...
Wordpress
Introduction to Exponential Functions
This lesson begins with a review of linear functions and segues nicely over its fifteen examples and problems into a deep study of exponential functions. Linear and exponential growth are compared in an investment task. Data tables are...
Willow Tree
Line Graphs
Some data just doesn't follow a straight path. Learners use line graphs to represent data that changes over time. They use the graphs to analyze the data and make conclusions.
Willow Tree
Circle Graphs
Pie isn't just for eating! Scholars learn to create pie charts and circle graphs to represent data. Given raw data, learners determine the percent of the whole for each category and then figure out the degree of the circle that percent...
Virginia Department of Education
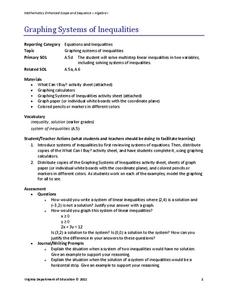
Graphing Systems of Inequalities
Apply systems of inequalities to a real-world problem. Here, scholars learn to graph solutions to systems of linear inequalities. To finish the lesson, they solve a problem involving burgers and cheeseburgers using a system of inequalities.
EngageNY
Analyzing Residuals (Part 1)
Just how far off is the least squares line? Using a graphing calculator, individuals or pairs create residual plots in order to determine how well a best fit line models data. Three examples walk through the calculator procedure of...
Flipped Math
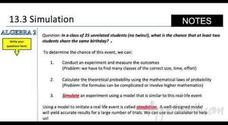
Simulations
Simulate an exciting graphing calculator-based lesson. Individuals watch and participate creating simulations using the random number generator in a graphing calculator to answer probability problems. Learners then build simulations to...
EngageNY
The Slope of a Non-Vertical Line
This lesson introduces the idea of slope and defines it as a numerical measurement of the steepness of a line. Pupils then use the definition to compare lines, find positive and negative slopes, and notice their definition holds for...
EngageNY
The Computation of the Slope of a Non-Vertical Line
Determine the slope when the unit rate is difficult to see. The 17th part of a 33-part series presents a situation that calls for a method to calculate the slope for any two points. It provides examples when the slope is hard to...
EngageNY
When Can We Reverse a Transformation? 1
Wait, let's start over — teach your class how to return to the beginning. The first lesson looking at inverse matrices introduces the concept of being able to undo a matrix transformation. Learners work with matrices with a determinant...
Willow Tree
Slope
Investigate the different types of slope using graphs and ordered pairs. Scholars use the slope formula to determine the slope of a line between two points. Includes examples with a slope of zero and with no slope. The lesson follows a...
EngageNY
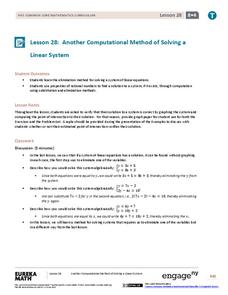
Another Computational Model of Solving a Linear System
The process of elimination really works! Use elimination when substitution isn't doing the job. The 29th segment in a series of 33 introduces the elimination method to solving linear systems. Pupils work several exercises to grasp the...
Ed Migliore
Linear Equations in Two Variables
This traditional textbook style unit includes vocabulary, a direct explanation section, examples, practice problems that directly line up with the explanations and examples, and a unit summary review and practice problems. Learners get...
EngageNY
Interpreting Correlation
Is 0.56 stronger than -0.78? Interpret the correlation coefficient as the strength and direction of a linear relationship between two variables. An algebra lesson introduces the correlation coefficient by estimating and then calculating it.
Mathed Up!
Scatter Graphs
Make an estimate by getting in line. The class works with scatter plots and lines of best fit to make an estimate for given values. Pupils determine whether there is a positive or negative correlation and draw a best-fit line. Using the...
Flipped Math
Correlation
Determine how close the line is to the scatter plot. Clear video instruction shows how to plot a scatter plot and find the best fit line using the linear regression function on a calculator. Pupils use the information from the calculator...
EngageNY
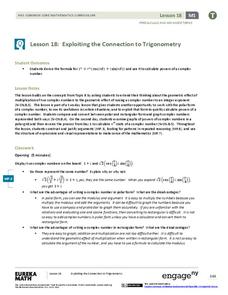
Exploiting the Connection to Trigonometry 1
Class members use the powers of multiplication in the 19th installment of the 32-part unit has individuals to utilize what they know about the multiplication of complex numbers to calculate the integral powers of a complex number. Groups...
EngageNY
Exploiting the Connection to Trigonometry 2
The class checks to see if the formula for finding powers of a complex number works to find the roots too. Pupils review the previous day's work and graph on the polar grid. The discussion leads the class to think about how to reverse...
EngageNY
Multi-Step Problems in the Real World
Connect graphs, equations, and tables for real-world problems. Young mathematicians analyze relationships to identify independent and dependent variables. These identifications help create tables and graphs for each situation.
UAF Geophysical Institute
Carbon Footprint
Your young environmentalists can calculate their carbon footprint and discuss ways to reduce it with a worksheet about climate change. After reading a handout about what impact one's carbon footprint can have on the environment, kids...


