Mathed Up!
Inequalities Regions
Discover how to solve systems of inequalities by graphing. An informative video shows pupils how to determine the solution set after graphing each inequality of a system. To finish, a learning exercise gives them a chance to practice...
Flipped Math
Modeling with Quadratics
Do some interpretive modeling. Class members watch three examples of interpreting key features of a graph of a quadratic to find solutions to a real-world problem. Learners review how to find the key features on a graph using technology...
Ed Migliore
Linear Equations in Two Variables
This traditional textbook style unit includes vocabulary, a direct explanation section, examples, practice problems that directly line up with the explanations and examples, and a unit summary review and practice problems. Learners get...
NOAA
A Matter of Density
Larvae transportation on the New England seamounts is based on the density of the water. Scholars calculate density and graph salinity versus temperature to better understand the distribution of organisms in a water column. Discussions...
CK-12 Foundation
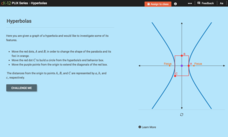
Hyperbolas
Hyperbolas—practice thinking outside of the box. Pupils alter the end behavior box to create various graphs of hyperbolas. They determine formulas to find the distance from the origin to the foci. Using that information, scholars...
Federal Reserve Bank
Making Sense of the Ups and Downs of Prices
What are the consequences and costs of inflation? What is CPI, and how do we calculate it? This resource answers these questions in an organized and in-depth manner, and also includes a worksheet of follow-up questions designed for an...
Curated OER
Button Bonanza
Collections of data represented in stem and leaf plots are organized by young statisticians as they embark some math engaging activities.
EngageNY
Another Computational Model of Solving a Linear System
The process of elimination really works! Use elimination when substitution isn't doing the job. The 29th segment in a series of 33 introduces the elimination method to solving linear systems. Pupils work several exercises to grasp the...
Kenan Fellows
Density
Most scholars associate density with floating, but how do scientists determine the exact density of an unknown liquid? The third activity in a seven-part series challenges scholars to find the mass and volume of two unknown liquids. Each...
Virginia Department of Education
Determining Direct Variation
Once learners realize what direct variation is, they see it's just a type of linear function. The lesson poses a general question that leads to the creation of the y = kx formula. The resource includes discussion prompts and ideas for...
Virginia Department of Education
Acid-Base Theory
Litmus paper, why so blue? A chemistry lesson includes a pre-lab activity, practice calculating pH, an experiment measuring the pH in acids and bases, a titration demonstration, and a titration experiment.
EngageNY
Interpreting Correlation
Is 0.56 stronger than -0.78? Interpret the correlation coefficient as the strength and direction of a linear relationship between two variables. An algebra lesson introduces the correlation coefficient by estimating and then calculating it.
EngageNY
Exploiting the Connection to Trigonometry 1
Class members use the powers of multiplication in the 19th installment of the 32-part unit has individuals to utilize what they know about the multiplication of complex numbers to calculate the integral powers of a complex number. Groups...
Baylor College
Body Mass Index (BMI)
How do you calculate your Body Mass Index, and why is this information a valuable indicator of health? Class members discover not only what BMI is and practice calculating it using the height and weight of six fictitious individuals, but...
Council for Economic Education
FRED and the Federal Budget Interactive Lesson
How can a federal debt accumulate over time? The Federal Reserve Economic Data (FRED) dashboard allows scholars to actively research each aspect of the federal budget. In pairs, they analyze economic data to determine the best way to...
Teach Engineering
Android Acceleration
Prepare to accelerate your Android. Pupils prep for the upcoming activity in this third installment of a four-part series. The lesson plan progresses nicely by first introducing different types of acceleration to the class. The teacher...
02 x 02 Worksheets
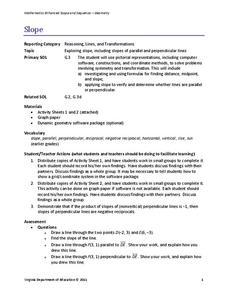
Slope
What does slope have to do with lines? Pupils work with lines and determine the slope of the lines informally and with the slope formula. Groups use their knowledge to calculate the slopes of parallel and perpendicular lines. They also...
Virginia Department of Education
Factoring for Zeros
Relate factors to zeros and x-intercepts. Scholars first graph quadratics in both standard and factored forms to see that they are the same. They go on to use the graphs to see the relationship between factors and x-intercepts.
Virginia Department of Education
Numbers in a Name
What's in a name? Pupils create a data set from the number of letters in the names of classmates. Each group then takes the data and creates a visual representation, such as a histogram, circle graph, stem-and-leaf plot, etc.
Flipped Math
Correlation
Determine how close the line is to the scatter plot. Clear video instruction shows how to plot a scatter plot and find the best fit line using the linear regression function on a calculator. Pupils use the information from the calculator...
Virginia Department of Education
Atomic Structure: Periodic Table
The fifth lesson of seven in the series outlines an in-depth analysis of the periodic table. After direct instruction, pupils take turns practicing in the group before beginning independent study. The assessments include a quiz and an...
Mathed Up!
Histograms
Class members explore how to read and use histograms by watching a video on creating and analyzing histograms. To finish, the class works on a set of questions that tests these skills.
Beyond Benign
Water Bottle Unit
How much plastic do manufacturers use to create water bottles each year? The class explores the number of water bottles used throughout the years to determine how many consumers will use in the future. Class members compare different...
Teach Engineering
Linear Regression of BMD Scanners
Objects may be more linear than they appear. Scholars investigate the relationship between the number of bone mineral density scanners in the US and time. Once they take the natural logarithm of the number of scanners, a linear...


