World Wildlife Fund
Bar Charts & Pie Charts
Learn about life in the Arctic while practicing how to graph and interpret data with this interdisciplinary lesson. Starting with a whole group data-gathering exercise, students are then given a worksheet on which they analyze and create...
Chicago Botanic Garden
Historical Climate Cycles
What better way to make predictions about future weather and climate patterns than with actual climate data from the past? Young climatologists analyze data from 400,000 to 10,000 years ago to determine if climate has changed over...
Berkshire Museum
Camouflage!: Collecting Data and Concealing Color
Help young scholars see the important role camouflage plays in the survival of animals with a fun science lesson. Starting with an outdoor activity, children take on the role of hungry birds as they search for worms represented by...
National Security Agency
Line Plots: Frogs in Flight
Have a hopping good time teaching your class how to collect and graph data with this fun activity-based lesson series. Using the provided data taken from a frog jumping contest, children first work together...
CPO Science
Physics Skill and Practice Worksheets
Stop wasting energy searching for physics resources, this comprehensive collection of worksheets has you covered. Starting with introductions to the scientific method, dimensional analysis, and graphing data, these skills practice...
Urbana School District
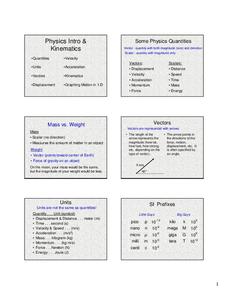
Physics Intro, Kinematics, Graphing
Some consider physics the branch of science concerned with using long and complicated formulas to describe how a ball rolls. This presentation, while long, is not complicated, yet it covers rolling, falling, and more. It compares vectors...
Discovery Education
Fuss About Dust
Dust is everywhere around us; it's unavoidable. But what exactly is dust and are certain locations dustier than others? These are the questions students try to answer in an interesting scientific investigation. Working independently or...
PBS
Data Plots of Exoplanet Orbital Properties
Scientists discovered the first exoplanet in 1995 and by early 2018, they confirmed the existence of more than 3,700—that's a lot of data! As part of the PBS 9-12 Space series, scholars interpret data about exoplanets. They compare...
Learning Games Lab
Scientific Graph Reading
Interpreting graphs is an essential skill for young scientists. An interactive online lesson gives individuals an opportunity to review the components of a graph and learn to read and interpret the shape of a graph. The lesson includes...
Curated OER
Water in the Geosphere
Through a PowerPoint presentation and the embedded animation and video, earth science enthusiasts find out about the moisture in the soil beneath our feet. In the animation, follow a water molecule on its path through the water cycle. As...
Columbus City Schools
Totally Tides
Surf's up, big kahunas! How do surfers know when the big waves will appear? They use science! Over the course of five days, dive in to the inner workings of tidal waves and learn to predict sea levels with the moon as your guide.
NOAA
A Matter of Density
Larvae transportation on the New England seamounts is based on the density of the water. Scholars calculate density and graph salinity versus temperature to better understand the distribution of organisms in a water column....
North Carolina State University
Exploring Genetics Across the Middle School Science and Math Curricula
Where is a geneticist's favorite place to swim? A gene pool. Young geneticists complete hands-on activities, experiments, and real-world problem solving throughout the unit. With extra focus on dominant and recessive genes, Punnett...
Virginia Department of Education
Weather Patterns and Seasonal Changes
Get your class outside to observe their surroundings with a lesson highlighting weather patterns and seasonal changes. First, learners take a weather walk to survey how the weather affects animals, people, plants, and trees during...
Las Cumbres Observatory
Craters in the Classroom
Laws of motion apply both in space and on Earth. Young experimenters model object impact on the Earth and moon. They use data to determine the effect mass and velocity have on the resulting craters and how that relates to the energy of...
Beyond Benign
Water Bottle Unit
How much plastic do manufacturers use to create water bottles each year? The class explores the number of water bottles used throughout the years to determine how many consumers will use in the future. Class members compare different...
Learning Games Lab
The Magic of Reading Graphs
Making conclusions from graphs doesn't need to seem like magic. Learners explore an interactive lesson on reading graphs to strengthen their skills. The content discusses how to read the axes of a graph and draw conclusions based on the...
Columbus City Schools
Speed Racers
Who wants to go fast? The answer? Your sixth-grade science superstars! The complete resource offers the ultimate, all-inclusive playbook for mastering the important concepts of speed versus time; distance versus time; and how...
Las Cumbres Observatory
Star In a Box
Stars may all look the same from down here, but their surfaces tell a different story. Using an animation, learners collect data about the temperature and luminosity of stars and compare them to their mass and radius. They then answer...
Howard Hughes Medical Institute
Color Variation Over Time in Rock Pocket Mouse Populations
While many mutations are neutral, those that appear advantageous increase in frequency in a population. Scholars use illustrations to make predictions about populations of mice. They follow it up with a video to confirm or refute their...
Teach Engineering
Complex Networks and Graphs
Show your class how engineers use graphs to understand large and complex systems. The resource provides the beginnings of graph theory by introducing the class to set theory, graphs, and degree distributions of a graph.
Teach Engineering
Android Acceleration
Prepare to accelerate your Android. Pupils prep for the upcoming activity in this third installment of a four-part series. The lesson progresses nicely by first introducing different types of acceleration to the class. The teacher...
Space Awareness
The Thermal Layers of Oceans
How much does the sun heat up a lake or ocean? Scholars use a cup and a strong lamp to investigate the heat transfer and thermal layers in the ocean to come up with the answer. They collect data and graph it in order to better understand...
ARKive
Handling Data: African Animal Maths
Handling and processing data is a big part of what real scientists do. Provide a way for your learners to explore graphs and data related to the animals that live on the African savannah. They begin their analysis by discussing what they...


