EngageNY
Nonlinear Models in a Data Context
How well does your garden grow? Model the growth of dahlias with nonlinear functions. In the instructional activity, scholars build on their understanding of mathematical models with nonlinear models. They look at dahlias growing in...
EngageNY
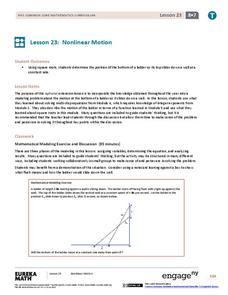
Nonlinear Motion
Investigate nonlinear motion through an analysis using the Pythagorean Theorem. Pupils combine their algebraic and geometric skills in the 24th lesson of this 25-part module. Using the Pythagorean Theorem, scholars collect data on the...
EngageNY
Relationships Between Two Numerical Variables
Is there another way to view whether the data is linear or not? Class members work alone and in pairs to create scatter plots in order to determine whether there is a linear pattern or not. The exit ticket provides a quick way to...
EngageNY
Patterns in Scatter Plots
Class members investigate relationships between two variables in the seventh installment of a 16-part module that teaches scholars how to find and describe patterns in scatter plots. Young mathematicians consider linear/nonlinear...
Concord Consortium
Systematic Solution I
Writing a general rule to model a specific pattern is a high-level skill. Your classes practice the important skill as they write rules describing the solutions to a system of equations with variable coefficients. As an added challenge,...
Inside Mathematics
Graphs (2004)
Show your pupils that perimeter is linear and area is quadratic in nature with a short assessment task that requests learners to connect the graph and equation to a description about perimeter or area. Scholars then provide a...
EngageNY
Exploring the Symmetry in Graphs of Quadratic Functions
Math is all about finding solutions and connections you didn't expect! Young mathematicians often first discover nonlinear patterns when graphing quadratic functions. The instructional activity begins with the vocabulary of a quadratic...
Curated OER
Hand Span and Height
Is there a relationship between hand span width and height? Statisticians survey each other by taking measurements of both. A table that can hold data for 24 individuals is printed onto the worksheet, along with questions for analysis....
Noyce Foundation
Between the Lines
Explore linear and square dimensions by comparing areas of similar figures. A creative set of five activities designed for elementary through high school classes asks young scholars to compare areas of specific polygons. The first two...
02 x 02 Worksheets
Inverse Variation
Discover an inverse variation pattern. A simple lesson plan design allows learners to explore a nonlinear pattern. Scholars analyze a distance, speed, and time relationship through tables and graphs. Eventually, they write an equation to...
Concord Consortium
Intersections II
How many intersections can two absolute value functions have? Young scholars consider the question and then develop a set of rules that describe the number of solutions a given system will have. Using the parent function and the standard...
EngageNY
Mid-Module Assessment Task: Grade 8 Module 6
Make sure pupils have the skills to move on to the second half of the module with a mid-module assessment task. The formative assessment instrument checks student learning before moving on to the rest of the lessons in the unit.
Inside Mathematics
Squares and Circles
It's all about lines when going around. Pupils graph the relationship between the length of a side of a square and its perimeter. Class members explain the origin in context of the side length and perimeter. They compare the graph to the...
Inside Mathematics
House Prices
Mortgages, payments, and wages correlate with each other. The short assessment presents scatter plots for young mathematicians to interpret. Class members interpret the scatter plots of price versus payment and wage versus payment for...
Inside Mathematics
Scatter Diagram
It is positive that how one performs on the first test relates to their performance on the second test. The three-question assessment has class members read and analyze a scatter plot of test scores. They must determine whether...
American Statistical Association
Scatter It! (Using Census Results to Help Predict Melissa’s Height)
Pupils use the provided census data to guess the future height of a child. They organize and plot the data, solve for the line of best fit, and determine the likely height and range for a specific age.
National Security Agency
Multiple Representations of Limits
After an introductory activity to demonstrate the theory of a limit, additional activities approach a limit from graphical, numerical, and algebraic methods. The activity looks at the multiple ways of understanding and evaluating a...
Albert Shanker Institute
Economic Causes of the March on Washington
Money can't buy happiness, but it can put food on the table and pay the bills. The first of a five-lesson unit teaches pupils about the unemployment rate in 1963 and its relationship with the March on Washington. They learn how to create...


