Illustrative Mathematics
Weather Graph Data
Teaching young mathematicians about collecting and analyzing data allows for a variety of fun and engaging activities. Here, children observe the weather every day for a month, recording their observations in the form of a bar graph....
PBS
The Cat in the Hat Activity Exploring Weather
Observe different types of weather right in your classroom! Here, pupils look at clouds, rain, snow, wind, and hot and cold temperatures, and observe these weather patterns at school. They keep track of their observations in a worksheet...
Chicago Botanic Garden
Weather or Not
What is the difference between weather and climate? This is the focus question of a lesson that takes a deeper look at how weather data helps determine climate in a region. Using weather and climate cards, young scholars decide...
UAF Geophysical Institute
Observing the Weather
How can you predict the weather without any technology? Young scientists learn to forecast the weather using traditional Native American techniques. Based on their observations of the weather, as well as talking to their classmates, they...
Prestwick House
Vocabulary Activity Sheet
What does it mean to stream a program? How do you know if you're watching a mash-up? If you don't know these words, reach for your handy Merriam-Webster dictionary, because they're there! A series of fill-in-the-blank questions...
Curriculum Corner
Book Study: The Mitten
Looking for a set of resources to compliment a reading of The Mitten by Jan Brett? A fun winter resource has everything from story sequencing and writing prompts to a parts of speech sort and a mitten flap book. The activities are great...
Port Jefferson School District
Hurricane Katrina
Young scientists track Hurricane Katrina across the Atlantic Ocean as they learn about these destructive forces of nature. Provided with a table of data tracking the location and conditions of Katrina over a one week span, students...
National Wildlife Federation
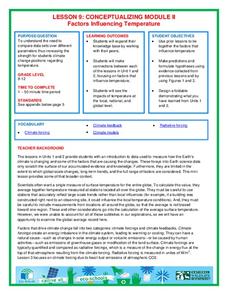
Conceptualizing Module II - Putting It All Together
"Creativity is just connecting things." - Steve Jobs. After weeks of researching climate change, the ninth lesson plan in a series of 21 combines the data and analysis to address essential questions. It covers natural phenomenon,...
National Wildlife Federation
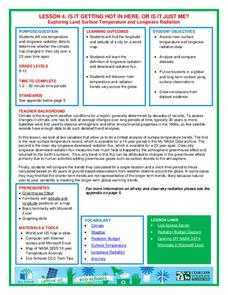
Is It Getting Hot in Here, or Is It Just Me?
Currently, only 2.1% of global warming is felt on continents, while over 93% is felt in the oceans. The fourth lesson in the series of 21 on global warming is composed of three activities that build off one another. In the first...
Centers for Ocean Sciences
Ocean and Great Lakes Literacy: Principle 7
Your mission, should you choose to accept it, is to take your class on an underwater adventure. The final installment in a seven-part series involving salt and freshwater bodies takes junior oceanographers below the surface in...
Macmillan Education
White Fang
Jack London's adventurous novel White Fang may seem removed from learners' everyday lives, but with an engaging set of reading activities, learners can relate to the story's themes. A three-page assignment delves into the...
American Museum of Natural History
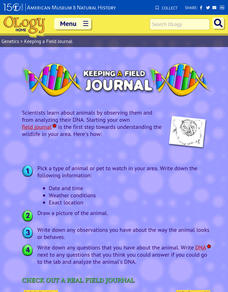
Keeping a Field Journal
Young scientists begin a field journal by following four steps. A real-world example of an entry showcases the different parts, including location, date, drawings, and more.
Code.org
Looping and Simulation
Young computer scientists continue programming with while loops by creating a program to simulate coins flipping.
Scholastic
Scholastic: Gather Data: Experiment With Weather
Simple guidelines for building several weather-related tools: anemometer, wind vane, barometer, rain gauge, snow gauge, and thermometer. After building your tools, follow experiment steps and record your findings on the Scholastic...
TeachEngineering
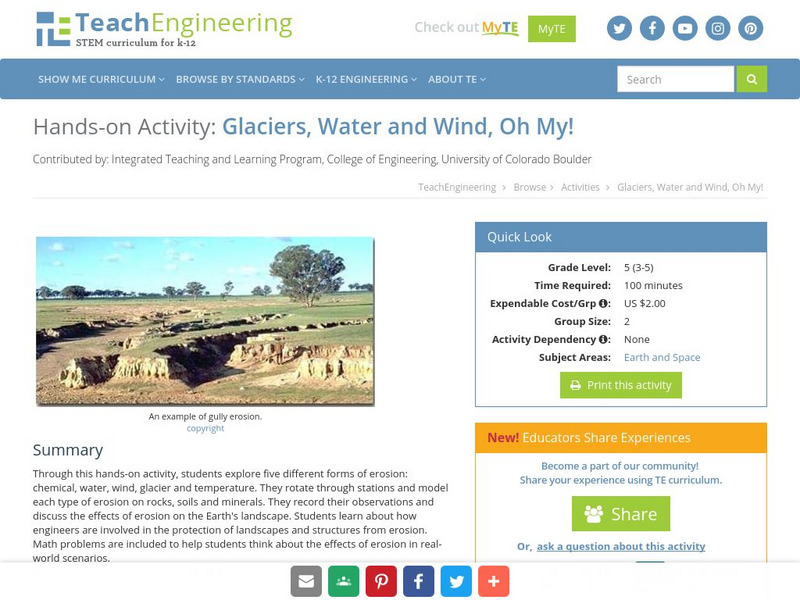
Teach Engineering: Glaciers, Water and Wind, Oh My!
This hands-on activity explores five different forms of erosion (chemical, water, wind, glacier and temperature). Students rotate through stations and model each type of erosion on rocks, soils and minerals. The students record their...
Science Education Resource Center at Carleton College
Serc: Classroom Phenology: The Environment a Source of Data and Observations
A unit where young scholars record daily temperatures, precipitation amounts, observations of weather patterns, shadow length of a set object, and other observations. In addition, they will complete a season-long weekly observation of a...


