Curated OER
And the Survey Says...
Create a survey and graph! In this graphing lesson, students listen to a story about pets, create a survey for family and friends about what pets they own, and use the information to create a bar and line graph.
Curated OER
Graph Groups (One Color)
In this graphing worksheet, students solve 5 problems in which the colored shapes in each set are counted. Students then fill out a bar graph to show how many of each color are in the sets.
Curated OER
Surveying and Graphing- Favorite Character in Charlotte's Web
In this math and literature worksheet, students survey classmates about their favorite character in Charlotte's Web and display the data on a bar graph. The blank graph is unlabeled; there are no lists of characters to choose from.
Curated OER
Trumpet of the Swan Favorite Character Graph
In this math and literature learning exercise, students survey classmates about their favorite character in the book Trumpet of the Swan. Students display the data on this blank bar graph.
Curated OER
Science: Teddy Bear Nation
Young scholars sort teddy bears according to types and then graph the results. They each bring a bear to class and then discuss their similarities and differences. Once the bears have been sorted into groups according to size and color,...
Curated OER
Fast Food Survey Using Bar Graphs
Second graders conduct survey and sort data according to categories, construct bar graph with intervals of 1, and write a few sentences about their graphs.
Curated OER
Is Your Favorite Time of the Day the Morning, Afternoon, Evening or Night? Bar Graph Recording Sheet
In this bar graph recording worksheet, students receive a numbers and record their preference for morning, afternoon, evening, or night. There are no directions given.
Curated OER
M&M's and the Scientific Method
Sixth graders explore the scientific method by conducting an in class experiment. For this scientific averages lesson, 6th graders discuss the concept of the scientific method, and define the different mathematical averages, mean, median...
Houghton Mifflin Harcourt
Nature Walk: English Language Development Lessons (Theme 2)
Walking in nature is the theme of a unit designed to support English language development lessons. Scholars look, write, speak, and move to explore topics such as camping, woodland animals, instruments, bodies of water, things found at a...
Curated OER
Which Graph is best?
Students use commercial software to organize and visually display data to draw conclusions; students use graphing software to create several types of graphs illustrating the number of each color of M&M's in one bag.
Curated OER
Fairy Tales
Sixth graders explore the elements of fairy tales. For this fairy tales lesson, 6th graders analyze several versions of Cinderella from around the world. Students graph fairy tale elements using Excel and create Venn diagrams comparing...
Curated OER
Social Studies Strategies: Attribute Graph
In this exploring an attribute graph worksheet, students read information and observe an attribute graph about Cinderella, and complete a bar graph about the attributes of a historical figure or climax of events. Students complete one...
Baylor College
Global Atmospheric Change: The Math Link
Change up the classroom atmosphere with this interdisciplinary resource. Following along with the children's book Mr. Slaptail's Curious Contraption, these math worksheets provide practice with a wide range of topics including simple...
Curated OER
Introduction to Dr. Seuss
First graders look at slides on the SMART Board of different facts about Dr. Seuss and then create a class bar graph of their favorite Dr. Seuss books. In this Dr. Seuss lesson plan, 1st graders review and list facts that they learned...
Pennsylvania Department of Education
Use Order of Operations to Evaluate Expressions—No Grouping Symbols
Students identify and explain different types of data collection and graphs. For this graphs and data collection lesson, students record their observations of a variety of data collection tools and graphs displayed in the room. Students...
Curated OER
Day Four: Surveys and results
Students use expressions of frequency in the English language. In this ELL lesson, student survey their classmates and turn the information into a class bar graph.
Alabama Learning Exchange
Tiger Math Graphing
Learners practice various skills using the book Tiger Math: Learning to Graph from a Baby Tiger. After listening to the story, they create a pictograph using data collected from the text. They also color a picture of a tiger, collect...
Curated OER
Human Fingerprints: No Two the Same
Sixth graders explore scientific observations by analyzing a group of data. In this fingerprint identification instructional activity, 6th graders identify the reasoning behind fingerprinting and create their own ink fingerprints....
Curated OER
Graphing With Paper and Computers
Fourth graders construct bar graphs. In this graphing lesson, 4th graders create bar graphs in connection with the story, The Copycat Fish. After creating the initial graphs on paper, students use MS Excel to create graphs.
August House
Why Koala Has a Stumpy Tail
Learn about the animals of Australia with a language arts lesson about an Australian folktale called, Why Koala Has a Stumpy Tail. After reading the story as a class, kids discuss events and characters from the book, retell the story to...
Curated OER
A Reading Graph
Young scholars construct and interpret a "favorite classroom books" graph. In this literacy and math graphing lesson, students choose a reduced size copy of the book cover that corresponds with the book(s) they chose to read during their...
Curated OER
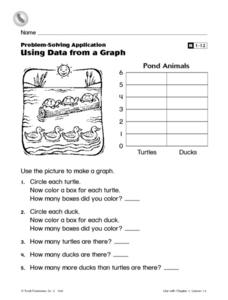
Using Data From a Graph
In this graphing worksheet, students create a bar graph with information from a picture of some pond animals. Students answer 5 questions about the graph.
Curated OER
Apple Adjectives
Study different apple varieties and use appropriate adjectives to describe them. Learners alphabetize both the apple names and the adjectives before creating spreadsheet, bar, and pie graphs. A mix of language arts, technology, and math!
Curated OER
Using Spreadsheets and Graphs
Third graders explore mathematics by utilizing computers. In this graphing lesson, 3rd graders gather class data based on a particular topic such as the "favorite candy" of the class. Students utilize this information and computers to...
Other popular searches
- Skittles Bar Graph
- Double Bar Graphs
- Bar Graphs Pictographs
- Histogram and Bar Graph
- Bar Graphs and Histograms
- Bar Graph Problem Solving
- Favorite Food Bar Graph
- Bar Graphs Histograms
- Interpreting Bar Graphs
- Bar Graphs for Birthdays
- Bar Graph Worksheet
- Bar Graphs and Charts


