Curated OER
Move My Way: A CBR Analysis of Rates of Change
Learners match a given velocity graph and sketch the corresponding position graph using a graphing calculator. After collecting data from their everyday life, students use specific functions on their calculators to create graphs and...
Curated OER
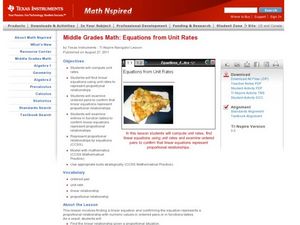
Equations from Unit Rates
Your class can become linear equations masters, as they calculate the rate of change of a function. They observe different types of coordinates as they relate to a graph, then use the Ti-navigator to move the line around and draw...
Curated OER
Focus on Economic Data: US Employment and the Unemployment Rate, March, 2012
Read all about the various types of unemployment and the United States is are currently at the low-point of an unemployment cycle. Kids examine what economic factors affect the unemployment rate, and what data shows for different US...
Curated OER
Rates of Chemical Reactions-The Iodine Clock Reaction
High schoolers investigate the reaction rate of iodine and soluble starch. In this rates of chemical reactions lesson plan, students study the effects of varying concentrations of reactants and varying temperatures of reactants on the...
Illustrative Mathematics
Find the Change
This exercise is an opportunity for algebra learners to understand the connection between the slope of a line and points found on the line. Use similar triangles to explain why slope m is the same between any two points. Discuss with the...
Curated OER
Climate Change in My City
Young scholars investigate the climate changes occurring locally, regionally and globally over the last one hundred years. They brainstorm and predict whether the current year's weather was warmer or colder than last year then check the...
Curated OER
Changing Planet: Melting Glaciers
Resource links to a video, satellite images, data, and photographs of glaciers provide emerging earth scientists the opportunity to examine how the ice has been retreating over the years. A data table is included for pupils to record...
Curated OER
Bacteria Populations
Your young microbiologists will interpret and solve exponential equations in this real-world context task set in a hospital research scenario. Learners think in terms of the functions as well as their rates of change.
California Academy of Science
Global Climate Change and Sea Level Rise
Ice is nice, and its condition on the planet has a significant effect. Junior geoscientists experiment with ice melting in both water and on land to discover how each affect the rising sea level. This detailed lesson outline even...
Curated OER
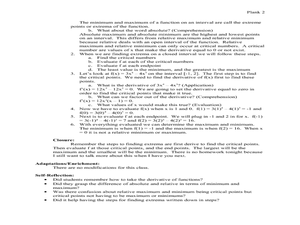
Extrema on an Interval
Students explore maximum and minimum points, slopes and tangents. In this Pre-Calculus lesson, students solve optimization problems and find rates of change.
Curated OER
Polly and the Shapeshifter
Students analyze the patterns in polygons and relate it to the rate of change. In this algebra lesson, students discuss the relationship between the data and the graph of the data.
Curated OER
Lessen the Loan
Middle-schoolers explore the concept linear equations. They use the internet to navigate through videos and problems. Pupils problem solve to determine rates of change, slope, and x and y-intercepts.
Curated OER
Rate of Coral Growth
Using a table of information provided, middle school marine biologists chart data on a graph to determine the impact of water depth on coral growth in Australia's Great Barrier Reef. Then they answer questions that connect the data to...
American Chemical Society
Condensation
It's time to break the ice! If you are doing all of the lessons in the unit, children have already seen that increasing heat increases the rate of evaporation, but is the opposite true? Does decreasing temperature cause more condensation...
Virginia Department of Education
The Rate of a Chemical Reaction
If your pupils think a catalyst is a list of their cats, then this might be the lesson for you! Young chemists study the effect of temperature, catalysts, concentration, and particle size on reaction rates during four different...
American Chemical Society
A Catalyst and the Rate of Reaction
More than 90 percent of chemical products are made using a catalyst. Lesson demonstrates the way a catalyst changes the rate of reaction without altering the chemical reaction. A catalyst doesn't appear as a reactant or a product, yet it...
Natinal Math + Science Initative
Slope Investigation
Context is the key to understanding slope. A real-world application of slope uses a weight loss scenario with a constant rate of change to introduce the concept of slope of a line, before it makes a connection to the ordered pairs and...
Virginia Department of Education
Linear Modeling
An inquiry-based algebra lesson explores real-world applications of linear functions. Scholars investigate four different situations that can be modeled by linear functions, identifying the rate of change, as well as the strength and...
EngageNY
Euler’s Number, e
Scholars model the height of water in a container with an exponential function and apply average rates of change to this function. The main attraction of the lesson is the discovery of Euler's number.
Project Maths
Introduction to Calculus
Don't let your class's heart rates rise as you introduce them to differentiation ... an inquiry-based instructional activity helps them keep it in check! The second instructional activity in a three-part series asks learners to analyze...
Kenan Fellows
Man vs. Beast: Approximating Derivatives using Human and Animal Movement
What does dropping a ball look like as a graph? An engaging activity asks learners to record a video of dropping a ball and uploading the video to software for analysis. They compare the position of the ball to time and calculate the...
Curated OER
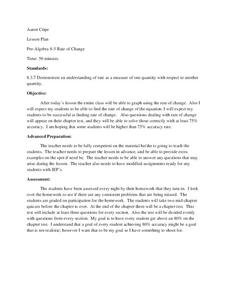
Rate of Change
Eleventh graders solve problems dealing with rate of change. In this algebra lesson plan, 11th graders graph their rate of change problems and analyze it comparing their data with each other. They solve problems dealing with percent and...
Chicago Botanic Garden
Historical Climate Cycles
What better way to make predictions about future weather and climate patterns than with actual climate data from the past? Young climatologists analyze data from 400,000 to 10,000 years ago to determine if climate has changed over time....
Nuffield Foundation
Investigating Factors Affecting the Heart Rate of Daphnia
What variables change heart rate? Young scientists observe the beating heart in Daphnia to understand these variables. They make changes in temperature, chemicals, and other factors as they graph the heart rates. Analysis questions help...
Other popular searches
- Slope Rate of Change
- Constant Rate of Change
- Average Rate of Change
- Powerpoint Rate of Change
- Rate of Change Math
- Rate of Change Graphs
- Rate of Change Algebra
- Heart Rate Change
- Rate of Change Project
- Slope and Rate of Change
- Exchange Rate Changes
- Rate of Change" Tables


