EngageNY
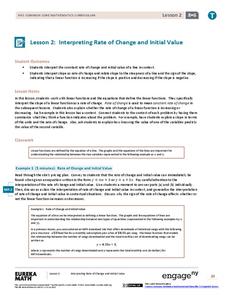
Interpreting Rate of Change and Initial Value
Building on knowledge from the previous instructional activity, the second instructional activity in this unit teaches scholars to identify and interpret rate of change and initial value of a linear function in context. They investigate...
EngageNY
Graphs of Linear Functions and Rate of Change
Discover an important property of linear functions. Learners use the slope formula to calculate the rates of change of linear functions. They find that linear functions have constant rates of change and use this property to determine if...
Curated OER
Building Understanding of Rate of Change/Slopes Using Alice
Learners explore slope as a rate of change. In this eighth grade mathematics lesson, students investigate real-world problems to determine rate of change and transform it into a linear representation, thus determining slope. Learners...
Curated OER
Rate of Change 1
In this rate of change worksheet, pupils use functions to determine the velocity of an object. This two-page worksheet contains ten problems.
Curated OER
Instantaneous Rate of Change of a Function
Pupils draw the graph of a door opening and closing over time. They graph a given function on their calculators, create a table of values and interpret the results by telling if the door is opening or closing and evaluate the average...
EngageNY
Average Rate of Change
Learners consider the rate of filling a cone in the 23rd installment of this instructional activity series. They analyze the volume of the cone at various heights and discover the rate of filling is not constant. The instructional...
West Contra Costa Unified School District
Average Rate of Change
Learners investigate average rates of change for linear functions and connect the concept to slope. They then determine average rates of change in quadratic and exponential functions.
Curated OER
Average Rate of Change, Difference Quotients, and Approximate Instantaneous Rate of Change
Pupils, with the assistance of their TI-84 Plus / TI-83 Plus calculators, distinguish meanings from right, left and symmetric difference quotients that include rate of change and graphical interpretations. They utilize symmetric...
Curated OER
Cardiac Output, Rates of Change, and Accumulation
Students explore rates of change. In this cardiac output lesson, students measure the amount of blood being pumped by a heart. They explore the flow rate and complete an accumulation and concentration problem. They analyze data, flow...
Curated OER
Rate of Change Graphically
Young scholars calculate the rate of change. In this algebra lesson, students identify the slope and discuss the different properties of lines as they relate to rate. A discuss doubling time, zero slope and being in two places at once.
West Contra Costa Unified School District
Average Rate of Change
The concept of slope gets an approachable, yet theoretical, treatment in a comprehensive algebra lesson. The use of functional notation and problem-solving techniques keep the material rigorous, but detailed teaching notes and lots of...
Illustrative Mathematics
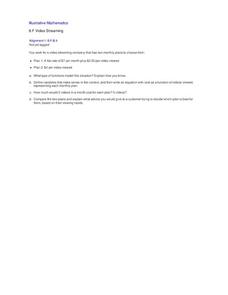
Video Streaming
Your movie fans will be interested in this resource. They will compare video streaming plans. One plan charges a set rate per month and a reduced viewing fee, and the other has a flat rate per each video viewed. Unfortunately, students...
Curated OER
Worksheet 12: Functions
In this math worksheet, students are given 7 problems in which they differentiate, figure rate of change, determine value, and prove formulas.
Curated OER
A Day at the Beach
Help learners determine the rate of change for the temperature of sand. They will collect data on the temperature of wet and dry sand over time with a heat lamp overhead. Then make a scatter plot of the data and find a linear model to...
Curated OER
Rate of Change
High schoolers observe and calculate slopes. In this algebra lesson, students graph equations and determine the pace at which the slope is changing. They use the navigator to see the change as they graph the lines around.
EngageNY
Percent Rate of Change
If mathematicians know the secret to compound interest, why aren't more of them rich? Young mathematicians explore compound interest with exponential functions in the twenty-seventh installment of a 35-part module. They calculate future...
Illustrative Mathematics
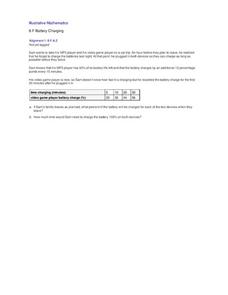
Battery Charging
Your class will be very interested in the results of this activity. How long does it take a MP3 and video game player to charge? Sam only has an hour and the MP3 player only has 40% of its battery life left. Plus, his video player is...
Curated OER
The Numbers Behind Hunger: Rate of Change
Explore the concept of world hunger by having students collect and graph 1990 world hunger statistics. They will analyze the data in order to determine how to decrease world hunger rates and try to determine problems and solutions of...
EngageNY
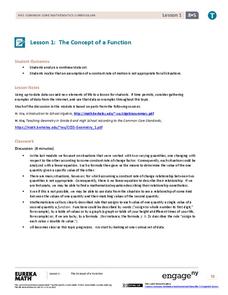
The Concept of a Function
Explore functions with non-constant rates of change. The first installment of a 12-part module teaches young mathematicians about the concept of a function. They investigate instances where functions do not have a constant rate of change.
Curated OER
Lesson #20 Rates of Change and Velocity
Students investigate speed. In this rate of change lesson plan, students complete a rate/time/distance table to determine the average m.p.h. of a given trip. They listen and follow along with the lecture and examples to determine the...
Curated OER
Changing Planet: Adaptation of Species (Birds and Butterflies)
A video about the impact of climate change on butterfly populations and a PowerPoint about butterfly and bird adaptations warm science learners up for the activity to follow. Using a variety of tools that reprsent unique styles of bird...
Curated OER
A Sweet Drink
Young scholars investigate reaction rates. In this seventh or eighth grade mathematics instructional activity, students collect, record, and analyze data regarding how the temperature of water affects the dissolving time of a sugar...
Curated OER
Algebra 1: Slope as Rate
Learners solve problems with slopes. In this algebra lesson, students identify the slope of a line and relate it to the rate of change. They graph their lines on the TI and observe changes in the lines.
EngageNY
The Binomial Theorem
Investigate patterns in the binomial theorem. Pupils begin by reviewing the coefficients from Pascal's triangle. They look at the individual terms, the sums of the coefficients on a row, and the alternating sum of each row. Individuals...
Other popular searches
- Slope Rate of Change
- Constant Rate of Change
- Average Rate of Change
- Powerpoint Rate of Change
- Rate of Change Math
- Rate of Change Graphs
- Rate of Change Algebra
- Heart Rate Change
- Rate of Change Project
- Slope and Rate of Change
- Exchange Rate Changes
- Rate of Change" Tables


