Kuta Software
Equations in Standard Form - Solving Systems by Graphing
Get to graphing and figure out the solution between two lines using this 14-problem worksheet. Graphs are provided for the first eight problems, but requires learners to graph the remaining six separately.
Charleston School District
Solving Systems Graphically
When guess and check gets old, it's time to start graphing! An instructive lesson explains how to solve a system of linear equations using graphing. Equations are in both slope-intercepts and standard form.
Curated OER
Solving One-Step Inequalities by Adding/Subtracting
In this solving inequalities learning exercise, students add and subtract to isolate the variable for 26 inequalities. Each solution is then graphed on a number line.
Charleston School District
Graphing Functions
How do letters and numbers create a picture? Scholars learn to create input/output tables to graph functions. They graph both linear and nonlinear functions by creating tables and plotting points.
Curated OER
Graphing Data
Seventh graders solve and graph 10 different problems that include various questions related to data on a graph. First, they create bar graphs to display the data given. Then, pupils determine the random sample of a population listing...
CPM
Tables, Equations, and Graphs
Eighth and ninth graders solve and graph 24 different problems that include completing input/output tables and graphing the pairs. First, they find the missing values for each table and write the rule for x. Then, students write the...
Regional Professional Development
Solving Systems of Equations by Graphing
With 30 problems, each accompanied by a blank graph, pupils get thorough practice solving systems of equations by graphing and finding the point of intersection. Answers are provided in coordinate form.
Curated OER
Solving Inequalities Self-Test
In this inequalities worksheet, students answer 6 multiple choice problems. Students then solve and graph 13 inequalities. Students answer 1 open-ended word problem.
Curated OER
Graphs
For beginners to picture graphs this is the perfect resource. They analyze two bar graphs that break down data visually so scholars can actually count the number in each column. For the first, they fill in how many of each type of pet is...
Da Vinci Design
Solving Systems of Equations
It can take a lot of time to create one instructional activity. You're in luck with a set of five systems of equations worksheets! Each version has a first page solving with substitution, elimination, and graphing; followed with an...
West Contra Costa Unified School District
Solving a System by Substitution
Solving systems by substitution can be a challenging topic in algebra I. Here is a lesson that builds on students' understanding of intercepts to begin the process of substitution, and all work is reinforced graphically to build...
Houghton Mifflin Harcourt
Graphs from Patterns
Fifth graders analyze patterns and begin looking at function tables. This is a pertinent preparation for graphing patterns. In fact, consider giving your class a piece of graph paper and then teach them how!
Charleston School District
Graphs of Linear Functions
What does a slope of 2/3 mean? Develop an understanding of the key features of a linear function. Pupils graph the linear functions and explain the meaning of the slope and intercepts of the graphs.
West Contra Costa Unified School District
Connecting Graphing and Solving Absolute Value Equations and Functions
Can you solve an equation graphically? Absolutely! This Algebra II lesson makes the connection between solving an absolute value equation and graphing two functions. Graphing absolute value functions is presented through the process of...
West Contra Costa Unified School District
Graphing Systems
Get hands on with solving systems of equations graphically. A solid lesson plan uses guided practice to show how to solve systems of linear equations. It allows time for sharing ideas and provides a printable matching activity to promote...
Charleston School District
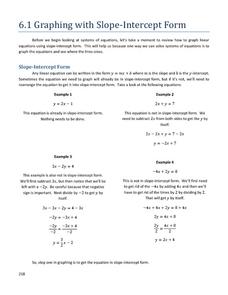
Graphing with Slope-Intercept Form
Work on graphing linear equations using the provided materials. The print and video lesson thoroughly review the concepts related to graphing linear equations in slope-intercept and standard form. The materials prepare learners for the...
Curated OER
Graphing
In this graphing worksheet, students solve and graph 10 different problems that include determining various coordinates and the slope. First, they use the table to write the x and y coordinates for each point on the graphs. Then,...
Curated OER
Graphing Inequalities
In this graphing inequalities worksheet, students solve and graph 10 different problems that include various inequalities. First, they study each of the examples given. Then, students graph the remaining equalities and inequalities as...
Curated OER
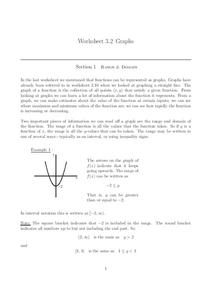
Graphs
In this graphs worksheet, students solve and complete 15 various types of problems. First, they determine the range of the function of the graph shown and write in interval notation. Then, students find the domain of the function in the...
Curated OER
IB Math SL 1 - Transformations and Combinations Worksheet
Study transformations and combinations with your advanced math class. They solve four graphing problems by graphing the transformations of a parent graph. They determine the equations to represent the given transformations of a parent...
Curated OER
Tim and Pat at the Store: Bar Graphs
Do you like candy? Tim and Pat go to the candy store every day after school. Can you use the chart to determine how much money they spend each day? Does one spend more than the other?
Mt. San Antonio Collage
Test 1: Functions and Their Graphs
Save the time creating an assessment because these function problems should do the trick. With 10 multi-part questions, they each focus on a different topic including radical, polynomial, linear and piecewise functions. The majority of...
Curated OER
Leveled Problem Solving: Circle Graphs
In this circle graphs worksheet, learners solve 6 word problems based on a circle graph about the most popular classes for sixth graders. Students calculate angle measures of circles for 2 of the problems.
Curated OER
Use a Graph
Information is often presented in graph form. Can your youngsters read a basic bar or picture graph? Six word problems accompany three graphs. One graph is a bar graph and the other two are pictographs.


