Curated OER
Data Analysis & Probability
High schoolers make predictions based on survey results. They calcuate sample proportions. Students estimate the number of voters in their district preferring the democratic candidate using their sample results. They review sample...
Curated OER
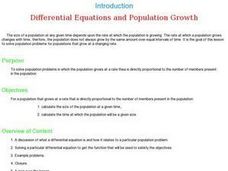
Differential Equations and Population Growth
Students determine the size of the population at a given time. They calculate the time at which the population will be a given number. They observe how the population grows at the rate that is directly proportional to the number of...
Curated OER
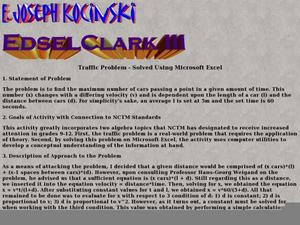
Traffic Problem- Solved Using Microsoft Excel
Students relate algebra to real life scenario. In this algebra lesson, students design a plan to help traffic flow smoothly using velocity and speed. This assignment is done using Microsoft Excel.
Curated OER
How Many Bears in the Forest?
Third graders model the tag and recapture of bears and use proportions to estimate the population of the bears in their forest. This is a statistical sampling method used by scientists and naturalists to determine population numbers.
EngageNY
Evaluating Reports Based on Data from a Sample
Statistics can be manipulated to say what you want them to say. Teach your classes to be wise consumers and sort through the bias in those reports. Young statisticians study different statistical reports and analyze them for misleading...
EngageNY
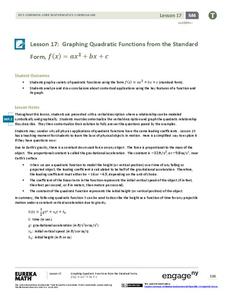
Graphing Quadratic Functions from the Standard Form
Use context to explain the importance of the key features of a graph. When context is introduced, the domain and range have meaning, which enhances understanding. Pupils use application questions to explore the key features of the graph...
EngageNY
Graphs of Quadratic Functions
How high is too high for a belly flop? Learners analyze data to model the world record belly flop using a quadratic equation. They create a graph and analyze the key features and apply them to the context of the video.
EngageNY
Part of a Whole as a Percent
Pupils use visual models, numeric methods, and equations to solve percent problems. To complete the second installment of 20, they find the part given the percent and the whole, find the percent given the part and the whole, and find the...
Curated OER
Be Direct - Oil Spills on Land
Students participate in an activity to simulate direct variation. In this oil spills on land lesson plan, students participate in a simulation using toilet paper and vegetable oil to explore the characteristics of direct variation. They...
Curated OER
How Much Is Too Much?
Students examine population growth and collect data. In this statistics lesson, students create a scatter plot to represent the different species found in the water and are being harvested. They graph their data and draw conclusion from it.
Curated OER
Applying Properties to Variables
Eighth graders combine like terms in this properties of variables lesson plan. Using named items (stars, moons and hearts), they combine like terms using variables. They use the distributive property to combine like terms. Finally, they...
Curated OER
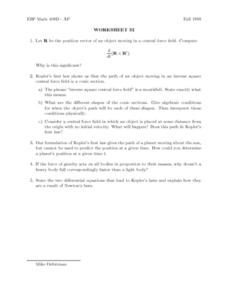
Worksheet 32: Kepler's Law
In this math worksheet, students are given 8 questions regarding Kepler's first law of motion. The questions include definitions, short essay explanations, and formulaic expressions.
Curated OER
Ratios, Rates, Percent and Nutrition
Examine food labels to determine percentage of fat and sugar to total calories with middle schoolers. Daily nutritional guidelines are discussed and learners will decide how well their foods fit into a healthy diet. In the provided...
02 x 02 Worksheets
Inverse Variation
Discover an inverse variation pattern. A simple lesson plan design allows learners to explore a nonlinear pattern. Scholars analyze a distance, speed, and time relationship through tables and graphs. Eventually, they write an equation to...
University of Nottingham
Drawing to Scale: A Garden
See how design and geometry go hand in hand. The activity asks learners to use geometry to design a backyard garden given dimensions of each feature. Scholars work with ratios and scale to develop an accurate scale drawing that includes...
EngageNY
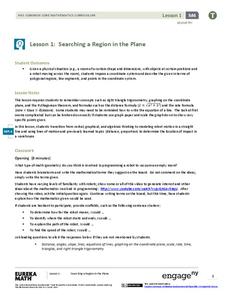
Searching a Region in the Plane
Programming a robot is a mathematical task! The activity asks learners to examine the process of programming a robot to vacuum a room. They use a coordinate plane to model the room, write equations to represent movement, determine the...
Curated OER
A Special Relationship
Students discover the relationships of the lengths of the sides of right triangles and right triangles using a series of drawings on dot paper. They investigate and solve problems of standard (customary and metric units) and non-standard...
Curated OER
Direct, Inverse, And Joint Variation
Learners engage in a lesson plan that has them practice solving equations using multiplication and division. They practice solving problems using the properties needed and then students practice changing word problems into an equation.
Curated OER
Fire!, Probability, and Chaos
Upper elementary and middle schoolers work with the concept of probability. They are introduced to the concept of chaos. Learners graph and analyze using a line plot, work with mean, and are introduced to the concept of variance.
Curated OER
Discovering Math Concepts in Business Mathematics, Economics, and Finance
Explore the concept of money and research its origin. There are many concepts related to business math, thusly, there are many formulas used to make calculations around money. Exchange rates of money in different countries, interest,...
Curated OER
Whole Numbers
Student are assigned one of the sections on whole numbers. After reviewing the content, they teach their assigned sections to other class mates. They publish their findings on a PowerPoint slide show to use when they teach their section.
Curated OER
Math: Currency Exchange Rates
Sixth graders apply the division and multiplication of decimals to convert dollars to various international currencies. In a travel simulation activity, they convert money, distance, and temperatures. During their "trip," students...
Curated OER
Meet the Neighbors: Planets Around Nearby Stars
Students explain why a transiting planet causes a periodic dimming in the light from its parent star. They determine the radius of a planet, and its orbital distance, by analyzing data and manipulating equations. Students compare the...


