Curated OER
The Great MPA Debate
Students study the 'Marine Protected Areas' process. In this ocean activity students work in groups, conduct research and present it to the class.
Curated OER
Gummy Bear Picture Graph
First graders investigate picture graphs. In this graphing lesson, 1st graders create a picture graph with the x-axis being number and the y-axis being color. Students sort their gummy bears by color and use pictures of colored bears...
Curated OER
Weather With a Latitude
Students read the temperature from a thermometer. In this weather lesson, students read a thermometer and record the temperature at twenty minute intervals. Students discuss results.
Curated OER
A Taste of Our Classroom
Students explore their classroom tastes. In this lesson plan, students list the four tastes that the tongue can detect, map the individual areas of taste on the tongue, and demonstrate the ability to identify objects through the use of...
EngageNY
Populations, Samples, and Generalizing from a Sample to a Population
Determine the difference between a sample statistic and a population characteristic. Pupils learn about populations and samples in the 14th portion in a unit of 25. Individuals calculate information directly from populations called...
Laboratory for Atmospheric and Space Physics
The Planets and Scale
Scholars gain an insight into the relative size of planets and distance between inner and outer planets with the help of informational text, a data table, and a series of four questions.
University of Colorado
Looking Inside Planets
Researchers use scientific data to understand what is inside each of the planets. The first in a series of six, this lesson builds off of that concept by having pupils use a data table to create their own scale models of the interiors of...
University of Colorado
Distance = Rate x Time
Every year, the moon moves 3.8 cm farther from Earth. In the 11th part of 22, classes use the distance formula. They determine the distance to the moon based upon given data and then graph Galileo spacecraft data to determine its movement.
Curated OER
Concept Formation Lesson Plan: Understanding "Protest"
After analyzing both examples and non-examples of a variety of protests conducted by ethnic groups in Seattle and the state of Washington during the twentieth century, your class members will work to identify the key ideas and components...
Scholastic
Study Jams! Pictograph
An easy and fun way to look at data is with a pictograph. A lesson plan friendly enough for multiple grade levels shows how to set up this graph with a corresponding key. The steps review the importance of choosing an appropriate...
Curated OER
Blogging To Create A Community of Writers # 5 of 7
Here is activity 5 from a 7 activity unit on using blogging to create a community of writers. The aim of this activity is to get students writing about what Archaeologists do and how they use material data to study the past. They compose...
Shodor Education Foundation
InteGreat
Hands-on investigation of Riemann sums becomes possible without intensive arithmetic gymnastics with this interactive lesson plan. Learners manipulate online graphing tools to develop and test theories about right, left, and midpoint...
Curated OER
Volcanoes: First Grade Lesson Plans and Activities
Introduce young geologists to types of volcanoes during the pre-lab. First graders explore how different liquids flow with an experiment on viscosity to simulate how different types of lava flow. Next, they learn about the parts of a...
PwC Financial Literacy
Saving and Investing: Investing for the Future
A fine lesson on saving and investing is here for you and your middle schoolers. In it, learners explore the values of time and money, and discover how small amounts of money invested over time can grow into a large "pot of gold." They...
Curated OER
Power Metering Project
Students collect and analyze variable data and understand the concept of electrical power. In this energy lesson students use a spreadsheet to manage their data and create box plots.
Curated OER
Bias in Statistics
Students work to develop surveys and collect data. They display the data using circle graphs, histograms, box and whisker plots, and scatter plots. Students use multimedia tools to develop a visual presentation to display their data.
Curated OER
Candy Colors: Figuring the Mean, Median, and Mode
Students count candy by color and then calculate mean, median, and mode. They count candy and use the data to calculate mean, median, and mode (by color) and apply their learning to another collection of data.
Curated OER
Math: Football Fever Fun
Learners compile statistics from high school or other football team and construct a spreadsheet on which to record their findings. Using Chart Wizard to analyze the data, they construct charts and graphs for a visual display of the...
Curated OER
Role-Playing Jean Talon
Students explore New France. In this New France lesson, students examine census data compiled by Jean Talon in 1665 and 1666. Students take on the role of Talon trying to convince the King of France to increase his investment in New...
Curated OER
The Fat and the Lean
Students collect data on calorie intake. In this algebra lesson, students use the collection of data to make better eating decisions. They investigate the nutritional value in food using a graph and draw conclusion from their findings.
Curated OER
Graphing Ordered Pairs
Seventh graders investigate the concept of ordered pairs as found in Algebra. They are introduced to the data set that corresponds to the coordinate system. Also students practice the graphing the ordered pairs using the x and y axis.
Curated OER
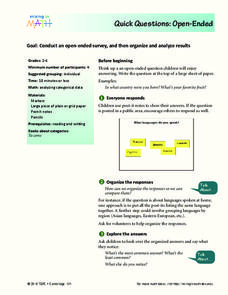
Quick Questions: Open-Ended
Students conduct an open ended survey and analyze the data they found. In this open-ended survey lesson plan, students ask others their open ended questions and then organize their results based on the most common, least common, and...
Curated OER
Fibers Lesson Plan
Young scholars explain how to use a light microscope, describe how to care for a microscope, and solve a forensic science problem, using a microscope to analyze data and draw conclusions.
Curated OER
My Four to Six Year Plan (My Personal Plan of Study)
Eighth graders examine what they need to do to meet their career goals. They design a four to six year plan for the classes they need to take in high school after listening to high school mentor tell about their experiences with this...


