Earth Watch Institute
Entering Local Groundhog Data in an Excel Spreadsheet
Here is a cross-curricular ecology and technology lesson; your learners create spreadsheets depicting the location and number of groundhog dens in a local park. They research groundhogs and analyze data about where the groundhog...
West Contra Costa Unified School District
Comparing Data Displays
There is so much more to data than just numbers, and this resource has learners use three methods of comparing data in a multi-faceted lesson. The 21-page packet includes a warm-up, examples, an activity, and assessment for a complete...
Curated OER
Show Me The Data!
Pupils create a bar graph. They will collect and organize data to turn into bar graphs. They create graphs for the favorite sports of the class, color of M&M's, and types of cars passing by.
Curated OER
Many Ways to Represent Our Data
Demonstrate several ways to represent data with your class. They will use surveys to gather data and display the data using tally charts and graphs. Then answer questions according to the data.
EngageNY
Variability in a Data Distribution
Scholars investigate the spread of associated data sets by comparing the data sets to determine which has a greater variability. Individuals then interpret the mean as the typical value based upon the variability.
Curated OER
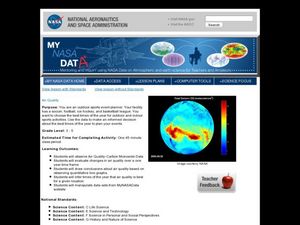
Air Quality
Students observe air quality and monoxide data. For this air quality lesson, students draw conclusions and manipulate data from a one year period on changes in air quality.
Curated OER
Deep Convective Clouds
Young scholars observe clouds. In this deep convective clouds lesson, students analyze cloud data recorded over one month and draw conclusions based on results. Young scholars predict "Thunderstorm Season" and prepare to defend their...
Curated OER
Sweet Data
Students input data about the colors of their serving of M&M candies onto a spreadsheet. They create charts and graphs based on this information.
Channel Islands Film
Island Rotation: Lesson Plan 3
How far have California's Channel islands moved? What was the rate of this movement? Class members first examine data that shows the age of the Hawaiian island chain and the average speed of the Pacific Plate. They then watch West of the...
Statistics Education Web
You Will Soon Analyze Categorical Data (Classifying Fortune Cookie Fortunes)
Would you rely on a fortune cookie for advice? The lesson first requires future statisticians to categorize 100 fortune cookie fortunes into four types: prophecy, advice, wisdom, and misc. The lesson goes on to have learners use...
Statistics Education Web
Are Female Hurricanes Deadlier than Male Hurricanes?
The battle of the sexes? Scholars first examine data on hurricane-related deaths and create graphical displays. They then use the data and displays to consider whether hurricanes with female names result in more deaths than hurricanes...
California Academy of Science
California's Climate
The United States is a large country with many different climates. Graph and analyze temperature and rainfall data for Sacramento and Washington DC as you teach your class about the characteristics of Mediterranean climates. Discuss the...
Curated OER
Pick A Number
Elementary schoolers find out which month has the most class birthdays (mode) and which birthday represents the middle point of all the birthdays (median). They gather and organize data to find one number that fairly represents the whole...
Curated OER
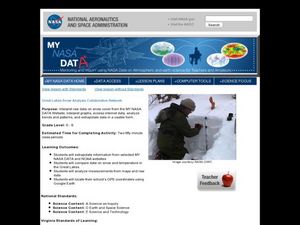
Great Lakes Snow Analysis Collaborative Network
Learners interpret data on snow cover and analyze trend patterns. In this snow instructional activity students compare data and locate their school's GPS coordinates.
Channel Islands Film
Arlington Springs Man: Lesson Plan 2
West of the West's documentary Arlington Springs Man and a two-page scientific article about the same topic provide the text for a reading comprehension exercise that asks individuals to craft a one page summary of information gathered...
Curated OER
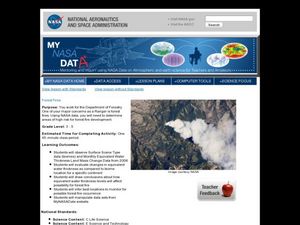
Forest Fires
Students play the role of a Ranger with the Department of Forestry. In this forest fires instructional activity, students examine data on biomes and images to determine high risk areas for forest fires to develop.
Curated OER
Cold, Clouds, and Snowflakes
Students explore satellite data and graphing. In this weather data analysis math and science lesson, students analyze NASA satellite data to draw conclusions about geographical areas where precipitation might have happened. Students...
Curated OER
Creating Climographs
Students use satellite data to compare precipitation and surface temperatures on different islands. In this satellite lesson students create graphs and explain the differences between weather and climate.
Curated OER
Building Brilliant Bar Graphs
Everything you need for a mini-unit on bar graphs is included in this lesson plan! It outlines three lessons and includes worksheets. Learners taste pretzels, shoot baskets (switching off hands), and grab candy, graphing results...
Curated OER
Using Data to Determine the Location of the Stiffest Opposition to School Desegregation in the 1970's
Students analyze historical data. In this school desegregation lesson plan, students make predictions about opposition to desegregation, examine the provided desegregation data, and determine if their predictions were correct.
Curated OER
Using MY NASA DATA to Determine Volcanic Activity
Students explore how aerosols are used in science to indicate volcanic activity and how biomass burning affects global aerosol activity. Students access data and import into MS Excel using graphical data to make inferences and draw...
Curated OER
Linear and Quadratic Model, Data Modeling
Students model quadratic and linear equations. In this algebra lesson, students solve word problems using equations. They create scatter plots and make predictions using correlations.
Curated OER
What's Data?
Learners get the opportunity to investigate the concept of data collecting. They explore how to tally and read a bar graph. Vocabulary about data is also be included. At the end of the lesson, individual students collect data independently.
Curated OER
1492: Using Data to Explain a Journey
Young scholars examine how Christopher Columbus made his way across the Atlantic. In this data instructional activity students use an Internet program to navigate like Columbus.


