TED Talks
TED: A vision of sustainable housing for all of humanity | Vishaan Chakrabarti
By 2100, the UN estimates that the world's population will grow to just over 11 billion people. Architect Vishaan Chakrabarti wants us to start thinking about how we'll house all these people -- and how new construction can fight climate...
Brainwaves Video Anthology
Don J. Leu - New Literacies
Donald J. Leu is the John and Maria Neag Endowed Chair in Literacy and Technology at the University of Connecticut. Dr. Leu directs the New Literacies Research Lab. He is an international authority on literacy education, especially the...
Curated Video
ChatGPT and Prompt Engineering With Advanced Data Analysis - Analyzing Net Promoter Score (NPS)
In this video, we will explore how ChatGPT can analyze Net Promoter Score (NPS) data in Excel. We will use ChatGPT's capabilities to calculate NPS, analyze NPS data using Excel functions, and visualize NPS results using charts/graphs for...
Packt
Create visual representations of data that models real-world phenomena or processes : Bar Charts
From the section: Data Visualization. In this section you will learn about data visualization, matplotlib library, bar charts, line charts and scatter plots. There’s also an activity for data visualization. Data Visualization: Bar Charts
Tarver Academy
How to Analyze the Data with Charts and Graphs in Google Sheets
In This Episode, Tyler Teaches Us About How to Analyze the Data with Charts and Graphs in Google Sheets
Curated Video
Multiplying Positive and Negative Integers Using a Number Line
In this video, the teacher explains how to multiply positive and negative integers using a number line. They emphasize the importance of accounting for the signs of the factors and demonstrate how to scale the number line accordingly....
Curated Video
How coronavirus charts can mislead us
How to read a popular chart of coronavirus cases by country. Support Vox by joining the Video Lab at http://vox.com/join or making a one-time contribution: http://vox.com/contribute Much of the data about the coronavirus epidemic and...
SciShow
SciShow Talk Show: Writer Jeremy Smith, Measuring Health & Freya the Pine Snake
In this episode Hank talks about global medical history and recorded death certificates with journalist Jeremy Smith. Special guest from Animal Wonders and SciShow Kids Jessi Knudsen Castañeda brings Freya the Northern Pine Snake.
The Bazillions
Super Sonic Rocket Bike
Blast off with The Bazillions on a journey of the imagination aboard a SUPER SONIC ROCKET BIKE!
Northeast Arkansas Education Cooperative
Construct and Interpret a Cumulative Frequency Histogram
The finer points of telling the difference between cumulative and frequency histograms are laid out with clear examples for how to get from one to the other. From defining vocabulary through converting charted data to histogram form,...
Federal Reserve Bank
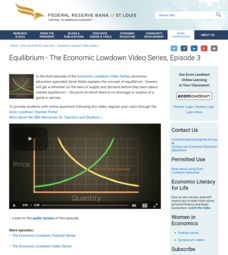
Episode 3: Equilibrium
Does the economy ever achieve a perfect balance? Scholars analyze how the market balances itself with supply and demand. The third episode in a 10-part video series on economics focuses on consumer demand and its impact on overall prices...
PolyMatter
Why China Ended its One-Child Policy
Was China's one-child policy a good idea? Historians analyze the country's one-child policy in place for more than 40 years. They view a short video explaining the revocation of the one-child rule and what it means for the future of the...


