NOAA
Ground-truthing Satellite Imagery with Drifting Buoy Data
Ground-truthing ... is it even a word? The last installment of a five-part series analyzes how scientists collect sea surface temperature data. Scholars use government websites to compare temperature data collected directly from buoys...
Curated OER
Conductivity - Pass the Buoy and Pepper, Please
Buoys around our coastlines are equipped with sensory devices which monitor temperature, salinity, and water pressure. Emerging earth scientists examine some of this data and relate salinity to the electrical conductivity of the surface...
Curated OER
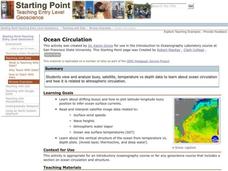
Ocean Circulation
Students view and analyze buoy, satellite, temperature vs depth data to study about ocean circulation and how is related to atmospheric circulation. They read and interpret satellite image data related to: Surface wind speeds, Wave...
NOAA
Tracking a Drifter
Be shore to use this drifter resource. The third installment of a five-part series has learners using the NOAA's Adopt-a-Drifter website to track to movement of a drifter (buoy) in the ocean. Graphing the collected data on a map allows...
NOAA
Graphing Temperatures
Battle of the hemispheres? In the fourth installment of a five-part series, young oceanographers use the NOAA website to collect temperature data from drifters (buoys), one in the Northern Hemisphere and one in the Southern Hemisphere....
Curated OER
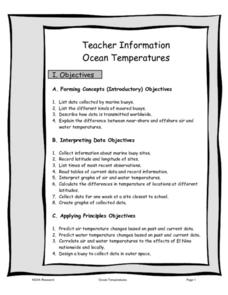
Ocean Temperatures
Students list data collected by marine buoys and the different kinds of moored buoys. They describe how data is transmitted worldwide. They explain the difference between near shore and offshore air and water temperatures.
Curated OER
Sea State
Students explain the process of wave formation and analyze the relationship between the ocean and the atmosphere. In this oceans lesson students use buoys to cast real time sea state conditions.
Nemours KidsHealth
Media Literacy and Health: Grades 6-8
Internet suffers could drown in the volume of information available on line. Here's an activity that can be a lifeline and buoy confidence in middle schoolers' ability to find reliable information and credible sources. After reading...
Curated OER
Lights, Shoals & Soundings
Students explore nautical charts and their symbols, with a bit of fun thrown in.
Curated OER
When is Dinner Served? Predicting the Spring Phytoplankton Bloom in the Gulf of Maine (College Level)
Students are able to explain the ecological importance of phytoplankton. They describe the components that influence a phytoplankton bloom. Students interpret satellite images in order to correlate buoy data.
Curated OER
Using Excel to Reference and Graph Live Data from a Web Site
Students collect live buoy data about water temperatures in the Gulf of Mexico from the Internet and work individually to organize their data and create a line graph using Excel Spreadsheet. Students analyze their data and examine any...
Curated OER
Deep Thoughts
Learners examine what lies within the Earth. They research and create scale models illustrating the layers of the Earth and write skits advocating a travel plan to send a probe into the Earth's mantle.
Curated OER
Biocomplexity Lab Activity: Density and Buoyancy of
Students investigate how the density of water changes the buoyancy of
water. Students create a hypothesis about what will happen when placing the
egg into the water.Students can research online different bodies of water (The Red Sea, The...
Curated OER
Bats and Hot Dogs
Students identify patterns and relationships from data that is collected and solve variables. In this investigative lesson students study ocean productivity, the nitrogen cycle and phytoplankton then answer questions.
Curated OER
Ocean Careers Exploration
Learners will work together in groups to gather information about careers in oceanography. They discover the need to have a diverse group of people on a team and then share their information with the class. Web links and materials are...
Texas State Energy Conservation Office
Investigation: Waves and Whistles
Wave goodbye to the same old demonstrations for alternative energy sources, and wave hello to this one investigating ocean waves! Using a water bottle to create an oscillating water column, learners see and possibly hear how the...
Curated OER
Azimuth and Altitude
Students use a compass and their hands to find positions of stars and planets in the night sky or of the sun during the day.
Curated OER
Coral Bleaching in the Caribbean
Students practice analyzing images, maps and graphs from Internet-based educational resources. They explore the correlation between sea surface temperature and coral bleaching. Students comprehend that coral reefs are collections of tiny...
Curated OER
NUMB3RS Activity: Where’s the Source? Episode: “Undercurrents”
Several real-world problems are posed as a way to learn about vector fields in order to make some predictions after analyzing the data. The main problem comes from the tv show NUMB3RS and is based on solving a crime where a body has...
US Environmental Protection Agency
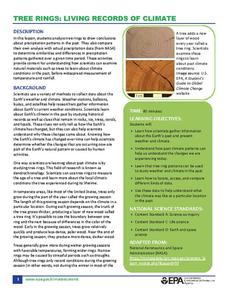
Tree Rings: Living Records of Climate
Open with a discussion on weather and climate and then explain how tree rings can provide scientists with information about the earth's past climate. Pupils analyze graphics of simulated tree rings from various US locations for the...
NOAA
A Laboratory Simulation of Ocean Surface Currents
Stimulate interest in ocean currents with a simulation. The first installment of a five-part middle school series teaches future oceanographers about the forces that interact to cause ocean currents. A simulation shows how wind and the...
Florida International University
The Good, the Bad and the Nasty Tasting
Examine the benefits of chemical defense mechanisms. Organisms in oceans use chemicals to ward off predators. Duplicate this adaptation using a hands-on experiment in which you ward off your predators (your pupils) with some bad-tasting...
NOAA
How Do We Know?: Make Additional Weather Sensors; Set Up a Home Weather Station
Viewers learn about three different weather measurement tools in installment five of the 10-part Discover Your Changing World series. They build weather vanes to collect data on wind speed, barometers to determine air pressure, and rain...
American Museum of Natural History
What do you Know About Climate Change?
Test the class's knowledge of the key components of climate change. A 10-question online quiz asks learners about weather, climate, greenhouse gases, and several other concepts related to climate change. Interactive and easy for...


