Curated OER
Domain and Range
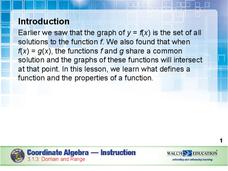
Relations, and functions, and line tests, oh my! An instructional slideshow demonstrates the definitions of a relation, a function, and the domain and range of a relation. Viewers then learn how to use mappings and vertical line tests to...
Mathematics Assessment Project
Representing Probabilities: Medical Testing
Test probability concepts with an activity that asks pupils to first complete a task investigating false positive in medical testing and then to evaluate sample responses to the same task.
Shodor Education Foundation
Function Machine
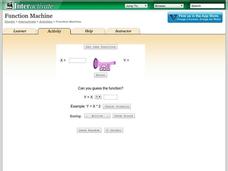
Machines can be so helpful sometimes. A simple interactive has learners enter input values for a function machine and observe output values. These values help determine a function that represents the input-output relationship in the...
Shodor Education Foundation
Equation Solver
Solve your equation and prove it, too. Young mathematicians solve linear equations using an interactive. They must input a property to justify each step of their solutions.
Shodor Education Foundation
Recursion
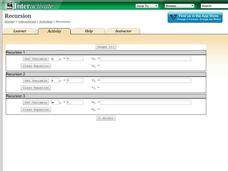
Perform the operation ... and then do it again. Scholars investigate recursive formulas by creating and graphing them. Using the interactive, pupils set the variable, determine the initial value, and type in a recursive formula.The...
Shodor Education Foundation
Scatter Plot
What is the relationship between two variables? Groups work together to gather data on arm spans and height. Using the interactive, learners plot the bivariate data, labeling the axes and the graph. The resource allows scholars to create...
Shodor Education Foundation
Buffon's Needle
Find the needle on a lined paper. Pupils run a simulation of dropping a needle on a lined paper. The probability of the needle crossing at least one line is pi/2. After each trial, the interactive displays the approximation of pi based...
Shodor Education Foundation
Coin Toss
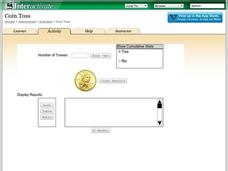
Are your young mathematicians having a hard time making heads or tails of probabilities? It's no toss up—here is a resource that's sure to straighten them out! Learners run the interactive to toss a coin a different number of times....
Shodor Education Foundation
Stem and Leaf Plotter
The key is in the leaves. Pupils enter data to create a stem-and-leaf plot. The resource then displays the plot and calculates the mean, median, and mode of the data. Using the plot and the calculated measures of spread, learners analyze...
Shodor Education Foundation
Skew Distribution
Slide the class into a skewed view. Learners alter the location of the median relative to the mean of a normal curve to create a skew distribution. They compare the curve to a histogram distribution with the same skewness.
National Council of Teachers of Mathematics
Eruptions: Old Faithful Geyser
How long do we have to wait? Given several days of times between eruptions of Old Faithful, learners create a graphical representation for two days. Groups combine their data to determine an appropriate wait time between eruptions.
Howard County Schools
Factoring Trinomials Using Tiles
What's the opposite of multiplying binomials? Learners apply their previous knowledge of multiplying binomials using algebra tiles to factor trinomials. The lesson introduces factoring as a process that uses algebra tiles to...
101 Questions
Taco Cart
Sometimes you just need a taco. Young mathematicians investigate two different paths on a beach to get to a taco cart. Completion of the task requires finding distances using the Pythagorean Theorem and considering the different walking...
Flipped Math
Calculus AB/BC - Reasoning Using Slope Fields
Find a solution in the field. An informative video presentation shows pupils how to use the information from a slope field to sketch the graph of a particular solution to a differential equation. Individuals learn how to determine the...
Curated OER
Solar and Lunar Eclipses
Students examine eclipses. In this eclipse lesson, students investigate solar and lunar eclipses. Students complete a WebQuest and write a descriptive summary of eclipses. Lesson references a WebQuest, but does not include a link.
Curated OER
The Milky Way and Beyond
Students consider the scale of the Milky Way Galaxy. In this Milky Way lesson, students hypothesize the length of time necessary to cross the Milky Way.
Curated OER
Exponential Growth and Exponential Functions
Learners explore the concept of exponential functions. In this exponential functions instructional activity, students model exponential growth about a high school population using an applet. Learners manipulate the applet to show the...
Curated OER
Cartesian Coordinate System
Middle schoolers explore the concept of the coordinate plane. In this coordinate plane lesson, students graph points on the coordinate plane using an applet. Middle schoolers graph functions using an applet. Students play a Maze Game...
Curated OER
Chaos
Students explore the concept of probability. In this probability lesson plan, students use a applet that demonstrates chaos and probability of spread for a forest fire. Students also play applets about the Game of Life and Rabbits and...
Curated OER
The Mandelbrot Set
Students explore the concept of Mandelbrot sets and Julia sets. In this Mandelbrot and Julia set lesson, students use a function integrator applet to investigate two-variable function iterations. Students use Julia set and Mandelbrot set...
Curated OER
The Bell Curve
Students explore the concept of the bell curve. In this bell curve lesson, students discuss the controversy associated with the bell curve. Students use an applet to explore a normal distribution. Students discuss mean, median, mode,...
Curated OER
Patterns in Pascal's Triangle
Young scholars examine the patterns that exist in Pascal's Triangle. They explore multiples and factors. Sudents use an applet to create and color the multiples in Pascal's Triangle.
Curated OER
Variables and Patterns: Determining an appropriate scale while graphing
Sixth graders determine appropriate scales when graphing data. In this graphing lesson plan, 6th graders use an the applet "Graph It" to determine what is an appropriate scale for their data.
Curated OER
Finding Remainders in Pascal's Triangle
Students use clock arithmetic to find remainders. In this patterns in math instructional activity, students explore the relationship between clock arithmetic and remainders using a computer applet. Students also identify patterns in...
Other popular searches
- Java Applet
- Computer Applet
- Pattern Block Applet
- Math Applets
- Applets Pascal Triangle
- Applets Writing
- Applets Language Arts
- Applets Negative
- Fraction Applet
- Applets Language
- Applets Wave
- Java Applet1


