Channel Islands Film
Island Rotation: Lesson Plan 3
How far have California's Channel islands moved? What was the rate of this movement? Class members first examine data that shows the age of the Hawaiian island chain and the average speed of the Pacific Plate. They then watch West of the...
Curated OER
Taking Its Toll
Students explore ratios. For this rates lesson, students create a ratio to compare the price of a toll to the distance travelled. They compute the average cost per mile, determine the slope between two ordered pairs, and make...
Willow Tree
Line Graphs
Some data just doesn't follow a straight path. Learners use line graphs to represent data that changes over time. They use the graphs to analyze the data and make conclusions.
Curated OER
Sandia Aerial Tram
Your learners analyze a table of real-life data in order to write an equation that best models the information. Exponential, quadratic, and linear rates of changes are all possibilities in this task.
National Wildlife Federation
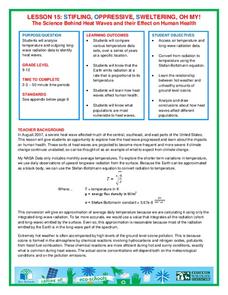
Stifling, Oppressive, Sweltering, Oh My!
Looking for a hot date? Pick any day in August, statistically the hottest month in the United States. The 15th lesson in the series of 21 instructs pupils to investigate the August 2007 heat wave through NASA data, daily temperature...
Curated OER
Time Changes Everything
Students analyze census data from 1915, 1967 and 2006. They read an article about how the world's population is growing at an alarming rate. They use primary source documents to create a timeline on the information they gathered. They...
The New York Times
Understanding the Mathematics of the Fiscal Cliff
What exactly is the fiscal cliff? What are the effects of changing income tax rates and payroll tax rates? Your learners will begin by reading news articles and examining graphs illustrating the "Bush tax cuts" of 2001 and 2003. They...
Space Awareness
Climate Zones
The climate at the equator is hotter than the climate at the poles, but why? The lesson goes in depth, explaining how the angles of illumination relate to the heating rate at different latitudes and seasons. Scholars use a strong lamp,...
Global Oneness Project
Witnessing Icebergs
Camille Seaman's photoessay, "Witnessing Icebergs" documents just a tip of the problem of climate change through images of icebergs in both the Arctic and Antarctic polar regions. After viewing the haunting images, viewers respond to a...
Mascil Project
Drug Concentration
Different medications leave the body at different rates, and how people take them determines their effectiveness. Learners investigate this effectiveness by charting the concentration of a given medication in the body. Using exponential...
Curated OER
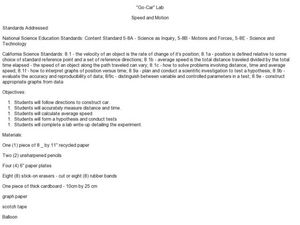
"Go-Car" Lab
Learners construct a car based on directions given. In this physics lesson, students calculate average speed using distance and time information. They collect data and create a graph of distance vs. time.
Curated OER
Extra Practice 11: Applications With Percents
In this percent worksheet, learners read short stories, determine the information needed, write an algebraic equation and evaluate the problem. Problems include simple interest, sale price, and tax rates. There are nine percent problems...
Curated OER
"Measurement in Motion"
Ninth graders examine the rate of motion and changes in motion using a ramp and a rolling object. They conduct the demonstration, determine the average speed, and describe how a moving object can have zero acceleration and deceleration.
Carnegie Mellon University
Bathtub Model
Using a colorful infographic handout and a guide sheet, hold a class discussion about how a bathtub can serve as a model for the greenhouse effect created by Earth's atmosphere. Participants will understand that as energy or matter is...
Curated OER
Factors Affecting Reaction Rate
Students study the collision theory and explain how the rate of a chemical reaction is influenced by the reaction conditions. For this reactions lesson students divide into groups, discuss the factors that influence reaction rate and...
Curated OER
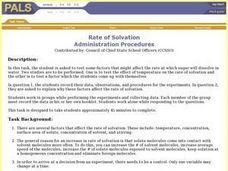
Rate of Solvation
Students test factors that may affect the rate at which sugar dissolve in water. They conduct two studies: One is to test the effect of temperature on the rate of solvation and the other is to test a factor which Students come up with...
Curated OER
Ins and Outs of Respiration
Students determine their respiratory rate and explore the factors that affect breathing rate.
Curated OER
Calorie Connection
Students calculate the calories in a Brazil nut and the calories needed for daily intake. In this calories lesson plan, students use calorimetry to measure the change in water temperature heated by the burning of a Brazil nut. They also...
Curated OER
Earth's Warming Climate: Are We Responsible
Students examine the atmospheric data for CO2. In this web-based atmospheric lesson plan, student follow instructions to examine and plot on-line scientific data about the CO2 levels in our atmosphere and analyze the changes found in the...
Curated OER
Mini Examination
Twelfth graders review the properties of derivatives without a calculator to get ready for their test. In this calculus lesson, 12th graders review average rate change, parametric equations, a line tangent to a curve, quotient rule, and...
Curated OER
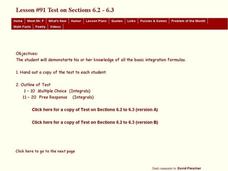
Test on sections 6.2-6.3
Twelfth graders review the properties of derivatives without a calculator to get ready for their test. In this calculus activity, 12th graders review average rate change, parametric equations, a line tangent to a curve, quotient rule,...
Curated OER
Final Exam Multiple Choice
Twelfth graders review the properties of derivatives without a calculator to get ready for their test. In this calculus activity, 12th graders review average rate change, parametric equations, a line tangent to a curve, quotient rule,...
Curated OER
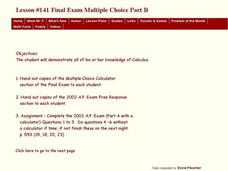
Final Exam Multiple Choice part B
Twelfth graders review the properties of derivatives without a calculator to get get ready for their test. In this calculus lesson, 12th graders review average rate change, parametric equations, a line tangent to a curve, quotient rule,...
Curated OER
Lab 2: Drag Racing
In this lesson plan, students, Analyze the relationship between velocity and acceleration * Calculate an object's average acceleration * Collect data and interpret it* Create and analyze a graph showing acceleration.Students also work in...


