Curated OER
Tracks are for Trains
Second graders collect data on different forms of transportation and create a bar graph or pictograph with the information.
Curated OER
Effect of Daylight Hours on Human Activity
Students determine the average hours of daily sunlight for each month of the year by constructing a bar graph. They develop a understanding of how the amount of daylight hours varies by month and how that affects both temperature and...
Curated OER
Classroom Census
Students identify the processes involved in data collection. They decide how census data can be used. Students engage in the data collection process and represent and interpret classroom data. They use scattergrams, arrow diagrams, block...
Curated OER
Math and Cinderella
Young scholars trace their feet and them compare the different sizes of classmates. They construct a bar graph showing the results of their classmates' feet size. They discuss what kinds of conclusions can be drawn from their observations.
Curated OER
Bug Hunt
Students strengthen observational skills by searching for insects in their home and classroom. In this observation lesson, students use magnifying glasses to classify what kinds of bugs were found. Students then create a bar graph to...
Curated OER
Let it Grow, Let it Grow, Let it Grow
Students investigate, through a hands-on activity, in which type of soil a bean seed grows best. They create a bar graph representing each plant's growth in different soils.
Curated OER
Make a Dinosaur
Students estimate the size of dinosaurs and create a dinosaur model. They create bar graphs of the sizes of dinosaurs one in meters and the other in "student" units. They draw a pictures and add words or sentences about their dinosaur.
Curated OER
Rolling Dice
Fourth graders investigate the mathematical concept of probability. They determine the given mean of a data set found when rolling dice. The results of the experiment are displayed using a bar graph. The teacher does an example before...
Curated OER
Rocks, Their Mass and Volume
Students measure volume using water displacement and mass using a balance. Once they have calculated these two values they will then calculate density while at the same time working on long division. After the activity and explanation of...
Curated OER
Future Careers of Middle School Students
In this math worksheet, learners examine the bar graph that is related to the statistics for the Careers of Middle School Students. They answer the five questions.
Curated OER
Recording Frequency
First graders analyze nursery rhymes and gather data about word frequency. In this frequency lesson plan, 1st graders create graphs and tables. Students interpret the data.
Curated OER
Names Count!
Second graders work in small groups to complete a graph and use data to determine range, mode, and median. They use the number of letters in their names and in fairy tale characters names to produce their data. This is a fun lesson!
Alabama Learning Exchange
Poppin' For Popcorn!
Students graph data from different popcorn flavors. In this graphing instructional activity, students make graphs using an assigned web site after collecting data about the flavors of popcorn that fellow classmates prefer.
Curated OER
French Fry Fun: Estimating and Measuring
Third graders demonstrate their estimating and measuring abilities. In this length measurement lesson, 3rd graders produce estimates of how long a handful of French fries will be before physically measuring them. Students graph their...
Curated OER
Understanding Presidential History
Students research to find the qualifications necessary to be President of the U.S. In this presidential qualification lesson, students research their family roots to see if they could qualify to be President. Students create a graph to...
Curated OER
Jack and the Beanstalk Math
Students listen to Jack and the Beanstalk and determine what they think are the most common words. In this Jack and the Beanstalk lesson, students reread the story, count the words they chosen and graph those words. Students graph the...
Curated OER
Conduction, Convection, Radiation, Oh My!
Students draw a line graph, and use graphing as a tool to discover more about conduction, convection and radiation. They should design their own experiment using heat sensitive paper to show they explain these 3 processes.
Curated OER
It's Your Life
Learners make a multiple line graph showing income levels for each education level for the past 8 years and the number of people for each ethnic group and gender is compared within each education level.
Curated OER
Download and Analyze
Students download information from a NASA website into a database. They transfer it to a spreadsheet by completing the information and analyze the information. They determine temperature averages, mode, and graph the results. They write...
Curated OER
Apples and Apple Activities
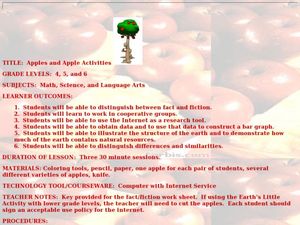
Students investigate apples. In this reading comprehension lesson plan, students read a book about apples then compare and contrast, make graphs, distinguish between fact and fiction and work in groups. Students work in groups to search...
Curated OER
Probabilities for Number Cubes
Middle schoolers explore the concept of probability. In this probability lesson, students roll a six-sided number cube and record the frequency of each outcome. Middle schoolers graph their data using a frequency chart and keep tally...
Curated OER
When Dinosaurs Ruled the World
Students graph the varying sizes of dinosaurs. In this math and dinosaur lesson plan, students view dinosaur models and compare the different shapes and sizes of the dinosaurs. Students complete a dinosaur math activity, read The...
Curated OER
Snack Attack
Students design charts, tables, graphs, and pictographs to analyse the types of snacks in a bag.
Curated OER
Fire Safety Survey
Students collect data regarding fire safety and create a graph. Working in small groups, they administer a survey to family and friends regarding their attitudes toward fire safety. After data has been gathered, students graph their...
Other popular searches
- Skittles Bar Graph
- Double Bar Graphs
- Bar Graphs Pictographs
- Histogram and Bar Graph
- Bar Graphs and Histograms
- Bar Graph Problem Solving
- Favorite Food Bar Graph
- Bar Graphs Histograms
- Interpreting Bar Graphs
- Bar Graphs for Birthdays
- Bar Graph Worksheet
- Bar Graphs and Charts


