EngageNY
The Concept of a Function
Explore functions with non-constant rates of change. The first installment of a 12-part module teaches young mathematicians about the concept of a function. They investigate instances where functions do not have a constant rate of change.
Curated OER
Equal Differences Over Equal Intervals 2
Your algebra learners explore linear functions concretely using tables of values in a collaborative task. The idea that linear function values change by equal differences over equal intervals, is emphasized. The slope and y-intercept...
Virginia Department of Education
Rational Functions: Intercepts, Asymptotes, and Discontinuity
Discover different patterns by making connections between a rational function and its graph. An engaging lesson asks scholars to explore the behavior of different rational functions. Groups discover a connection between the function and...
EngageNY
Graphs of Exponential Functions
What does an exponential pattern look like in real life? After viewing a video of the population growth of bacteria, learners use the real-life scenario to collect data and graph the result. Their conclusion should be a new type of graph...
EngageNY
Wishful Thinking—Does Linearity Hold? (Part 2)
Trying to find a linear transformation is like finding a needle in a haystack. The second lesson in the series of 32 continues to explore the concept of linearity started in the first lesson. The class explores trigonometric, rational,...
Curated OER
Exploring Exponential Growth and Decay Functions
Students differentiate between exponential growth and decay. In this algebra instructional activity, students solve exponential equations using properties of exponents. They use the Ti calculator to graph and analyze their functions.
EngageNY
Algebraic Expressions—The Distributive Property
Do your classes truly understand the distributive property? Use a demonstrative lesson to represent the distributive property in various ways. Learners solidify understanding by creating a geometric pattern for distributive property, and...
EngageNY
Trigonometry and Complex Numbers
Complex numbers were first represented on the complex plane, now they are being represented using sine and cosine. Introduce the class to the polar form of a complex number with the 13th part of a 32-part series that defines the argument...
Curated OER
Patterns, Functions, and Algebra: Wired for Space
Students assess how patterns, functions and algebra can assist NASA engineers design new ways of propelling spacecrafts. They explore how electricity and magnetism are replacing the fuel-consuming rocket propulsion. Electromagnetism is...
Curated OER
Functions & Algebra
Students examine linear equations. For this functions and algebra lesson, students write equations in the slope-intercept form. They enter data in a graphing calculator, examine tables, and write linear equations to match the data.
Curated OER
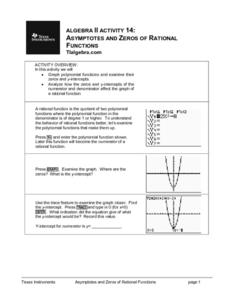
Asymptotes And Zeros of Rational Functions
Budding mathematicians graph polynomial functions and examine their zero and y-intercepts. They analyze how the zero and y-intercepts of the numerator and denominator affect the graph of a rational function. Several great additional...
EngageNY
Modeling Riverbeds with Polynomials (part 2)
Examine the power of technology while modeling with polynomial functions. Using the website wolfram alpha, learners develop a polynomial function to model the shape of a riverbed. Ultimately, they determine the flow rate through the river.
Illustrative Mathematics
Logistic Growth Model, Abstract Version
Here learners get to flex some serious algebraic muscles through an investigation of logistic growth. The properties of the constant terms in the logistic growth formula are unraveled in a short but content-dense activity. Moving...
Curated OER
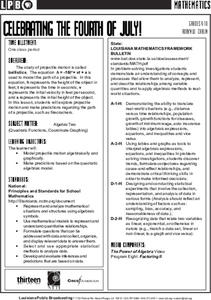
Celebrating the Fourth of July!
Students model projectile motion algebraically and graphically; and make predictions based on the quadratic algebraic model.
Curated OER
Exploring Quadratic Data with Transformation Graphing
Using a data collection device to collect data regarding a bouncing ball, learners use various features on graphing calculators to experiment with the parameters of the vertex form of the parabola and their effect on the shape of the...
Curated OER
Solving Equations Using Models
Explore mathematics by analyzing images. As they view pictures on the SMART Board, individuals must write corresponding algebraic equations. They utilize models to visualize the math expressions.
Curated OER
Latitude
Your young geologists generate a graph given a table of values from the context of latitude and percent of the earth's surface north of that latitude. The questions in the activity then focus the learners to a deeper understanding of the...
Curated OER
Exponential Reflections
High Schoolers explore the concept of exponential reflections. They use their Ti-Nspire to reflect the natural logarithm function over the line y=x. Students repeat the process using different exponential functions using a slider.
Texas Instruments
Finding Linear Models Part III
Explore linear functions! In this Algebra I lesson, mathematicians graph data in a scatter plot and use a graphing calculator to find a linear regression and/or a median-median line. They use the model to make predictions.
EngageNY
The Graph of a Function
Mathematics set notation can be represented through a computer program loop. Making the connection to a computer program loop helps pupils see the process that set notation describes. The activity allows for different types domain and...
EngageNY
Graphs of Quadratic Functions
How high is too high for a belly flop? Learners analyze data to model the world record belly flop using a quadratic equation. They create a graph and analyze the key features and apply them to the context of the video.
Curated OER
Algebra I - Test
Young scholars participate in a lesson that reviews the concept of linear functions in connection with preparation for an exam. The teacher reviews problems with the students for scaffolding. Young scholars practice graphing linear...
Curated OER
Iterating Linear Functions
Students use a spreadsheet to investigate data. In this algebra lesson plan, students collect and graph data on a coordinate plane. They explain properties of a linear equation both algebraically and orally.
Curated OER
Linear Functions-Learn Your Lines
Students solve and graph linear equations. In this algebra lesson, students collect and plot data on a coordinate plane. They use the CBL and TI calculator to graph systems of equation.


