Curated OER
Participles
In this participles worksheet, students complete a ten question multiple choice on-line interactive worksheet. Students choose the best word to fit into the sentence.
Curated OER
Could You Be a Star?
In this personality quiz worksheet, students complete 5 multiple choice questions. Students add their score and find out what kind of "star" they are: sports, movie, rock, or super star. The questions are best suited for UK students.
Curated OER
Household Go-Togethers
In this household items worksheet, students match the 5 pairs of items found in a house to show what belongs together. Students draw a line to connect the items that match.
Cherry Creek Schools
Physical Science Final Exam Review Packet
If you need a way to assess the concepts in your physical science class, use an extended set of worksheets as a midterm or final exam. It includes questions about density, physical and chemical matter, speed and velocity, weight and...
Curated OER
Shaquille O'Neal Hand & Foot Span
If Shaquille O'Neal wears a size-20 shoe, how big are his hands? Learners will use the average ratios of foot length to hand span to calculate the hand span of Shaq, but first, they have to collect the data! They will...
Curated OER
Walking the Plank
This is a cool math activity. Kids collect and interpret data based on a physical act. A board is balanced between a scale and a step, learners record a peer's weight as it decreases while s/he walks further away from the scale. They...
Virginia Department of Education
How Much is that Tune?
Tune in for savings! Scholars investigate pricing schemes for two different online music download sites. After comparing the two, they determine the numbers of songs for which each site would be cheaper.
Virginia Department of Education
Linear Modeling
An inquiry-based algebra lesson explores real-world applications of linear functions. Scholars investigate four different situations that can be modeled by linear functions, identifying the rate of change, as well as the...
Curated OER
The Big Bang-Hubble's Law
In this Hubble's law worksheet, students use data for galaxies which include their distance and speed. Students make a graph to show the distance to each galaxy and the speed of each galaxy. They use their graph to answer 4 questions...
Curated OER
Shaquille O'Neal Hand/Foot Span: Student Worksheet
Here's a clever math worksheet that has learners measure their hand span, foot length, come up with a ration, then use that information to figure out the hand span, and foot length of basketball giant Shaquille O'Neal. A good activity!
Curated OER
View Tubes: Student Worksheet
Here is a worksheet that is almost a lesson! In it, learners conduct an experiment in which they determine the size of objects when viewed through viewing tubes. This resource has all of the instructions and tables necessary to complete...
Curated OER
Shaquille O'Neal Hand/Foot Span
Shaquille O'Neal has huge hands and feet, and learners will use those two measurements to practice collecting and extrapolating data using ratios. They record the measurement of foot and hand span of several of their classmates, then...
Houston Area Calculus Teachers
Area and Volume
An AP calculus lesson begins with an activity to determine the volume of a solid using a cross-section. Next, learners review the ways to find the area between two curves , as well how to find the volume of a solid created...
Charleston School District
Sketching a Piecewise Function
How do you combine linear and nonlinear functions? You piece them together! The lesson begins by analyzing given linear piecewise functions and then introduces nonlinear parts. Then the process is reversed to create graphs from given...
Virginia Department of Education
Scatterplots
Math is all fun and games with this activity! Learners use an activity designed around hula hoops to collect data. They create scatter plots with their data and then analyze the graphs for correlation.
Curated OER
Drops on a Penny
Young scientists explore the concept of surface tension at is applies to water. In this activity, learners use a dropper to place drops of water on a penny. Each group guesses how many drops a heads-up penny will hold, then conducts the...
Louisiana Department of Education
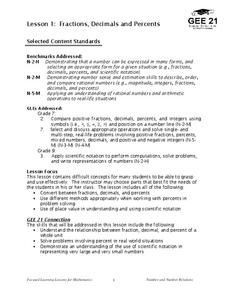
Fractions, Decimals, and Percents
Fractions, decimals, and percents all say the same thing! Show your classes how to convert between the three forms using visual and numeric representations. Then lead them to an understanding of scientific notation.
WK Kellogg Biological Station
Plotting Phenology
Finally, a worksheet that involves more than filling in some blanks. Your budding ecologists must graph and analyze three sets of data, then synthesize the information as they think about the impacts of plant reproduction on insects and...
Curated OER
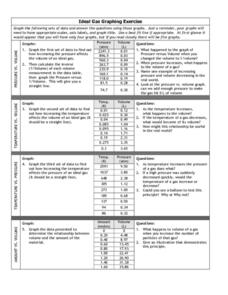
Graphing Exercise of Ideal Gas Data
In this graphing of Ideal Gas Data worksheet, students use the given data to draw 4 graphs of the given data. They are given the pressure and volume to draw and interpret the graphs.
Curated OER
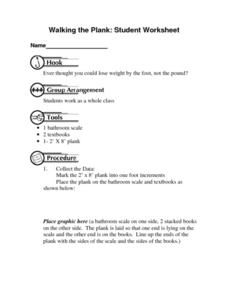
Walking the Plank: Student Worksheet
In this math worksheet, students will work in a group to experiment with the weight of objects when placed at a distance from a scale (using a plank). Students will record and graph their results.
Curated OER
Density of Pennies Lab
In this density of pennies worksheet, student conduct an experiment to determine the metals used in the core of pennies made after 1983. High schoolers design their own experiments using a balance and graph paper to determine the density...
Creative Chemistry
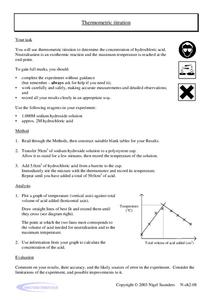
Thermometric Titration
In this thermometric titration learning exercise, students titrate hydrochloric acid with sodium hydroxide to determine its concentration. They measured the solution's change in temperature, plotted their data, and used the graph to find...
Curated OER
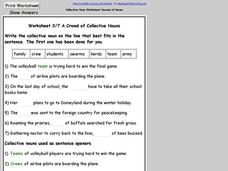
Worksheet 2/7 on Collective Nouns
In this recognizing collective nouns worksheet, students use collective nouns in a word bank to fill in the blanks in sentences. Students write 7 answers.
Creative Chemistry
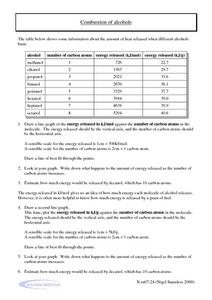
Combustion of Alcohols
For this combustion worksheet, learners complete two problems using a table showing the amount of heat released when different alcohols burn. They then create two graphs plotting the energy release against the number of carbon atoms.
Other popular searches
- Line of Best Fit
- Lines of Best Fit
- Math Best Fit Line
- Best Fit Linear Data
- Algebra Line of Best Fit
- Best Fit Line Worksheets
- Best Fit Linear Data"
- Correlation Best Fit Lines
- Graphing Best Fit Linear Data


