Regents Prep
Activity to Show Sample Population and Bias
There is bias in many aspects of our lives, and math is no exception! Learners explore provided data to understand the meaning of biased and random samples. The resource includes various data sets from the same population, and...
Curated OER
Using Random Sampling to Draw Inferences
Emerging statisticians develop the ability to make inferences from sample data while also working on proportional relationships in general. Here, young learners examine samples for bias, and then use random samples to make...
Curated OER
Sampling Bias And the California Recall
Using a 2002 California Gray David recall vote as an example, young statisticians identify sources of bias in samples and find ways of reducing and eliminating sampling bias. They consider ways to select random samples from a...
Willow Tree
Data Sampling
Some say that you can make statistics say whatever you want. It is important for learners to recognize these biases. Pupils learn about sample bias and the different types of samples.
Flipped Math
Sampling Methods
Pupils watch a video to learn about different types of sample design and how to use technology to create a random sample. They discover different types of bias that may happen due to the sampling design or the questions. Learners use...
EngageNY
Evaluating Reports Based on Data from a Sample
Statistics can be manipulated to say what you want them to say. Teach your classes to be wise consumers and sort through the bias in those reports. Young statisticians study different statistical reports and analyze them for...
Curated OER
Graphing Data
Seventh graders solve and graph 10 different problems that include various questions related to data on a graph. First, they create bar graphs to display the data given. Then, pupils determine the random sample of a population listing...
Curated OER
Galaxy Hunter - A Cosmic Photo Safari
Space science stars journey through our night sky and take virtual photos of galaxies to investigate simple random samples. Higher math is used to analyze the data collected. Copy the evaluation/assessment questions onto a handout...
American Statistical Association
Chocolicious
To understand how biased data is misleading, learners analyze survey data and graphical representations. They use that information to design their own plans to collect information on consumer thoughts about Chocolicious cereal.
American Statistical Association
How Long Are the Words in the Gettysburg Address?
It's 268 words, but one only needs to consider 10 of them at a time. A data collection and analysis activity has learners investigate the lengths of words in the Gettysburg Address. They first self-select a sample of 10 words and...
Curated OER
Research Methods in Psychology
This 5-question psychology review provided by Sparknotes addresses sampling bias, correlative data, statistical significance, and more.
Radford University
The Science of Surveys
To drill or not to drill? An informative unit has scholars first research the advantages and disadvantages of oil drilling in Alaska. They set up and conduct a sample survey to assess attitudes toward oil drilling in a specific...
College Board
2008 AP® Statistics Free-Response Questions Form B
To know what is on the test would be great. The six free-response question from the second form of the 2008 AP® Statistics gives pupils an insight into the format and general content of the exam. Each question requires the test...
Curated OER
Data Analysis Worksheet
In this probability activity, 11th graders solve problems using simple random sample, cluster sample, bias, population and systematic sample. They match the questions to its definition.
Curated OER
Interpreting Data and Statistics
Students define random sample and complete surveys. In this algebra lesson plan, students create surveys and define the way people analyze these results. They discuss random sample as it relates to the Great Depression and come up with...
Fort Bend Independent School District
Data Analysis - AP Statistics
What better way to study survey design than to design your own survey! Bring a versatile data analysis project to your AP Statistics class, and encourage them to apply the practices from their instructions to a real-world survey...
Curated OER
Questioning NASA
Space science and math collide in this inquiry that investigates launching times for antacid-tablet rockets! Upper elementary or middle school learners collect data as they launch these mini rockets. They apply concepts of place value...
Curated OER
Maps
Students investigate threee types of maps. In this algebra instructional activity, students idenitfy different maps and explore how they relate to the area keeping cllimate and topography in mind. They discuss maps used to navigate...
CK-12 Foundation
Ck 12: Statistics: Sampling Methods
[Free Registration/Login may be required to access all resource tools.] Decide how to choose a sampling of a population to produce reliable statistical results.
Web Center for Social Research Methods
Research Methods Knowledge Base: Sampling in Research
Site discusses the use of sampling in research. The key statistical terms used in sampling are linked for the user to quickly find definitions. The major concepts of probability and nonprobability are also highlighted.
Other
University at Albany: Populations and Samples: The Principle of Generalization
This resource explains what generalization is in statistics, its advantages and disadvantages, and problems that can occur, e.g., sample or response bias. Includes detailed examples of sampling error and sample bias.
Houghton Mifflin Harcourt
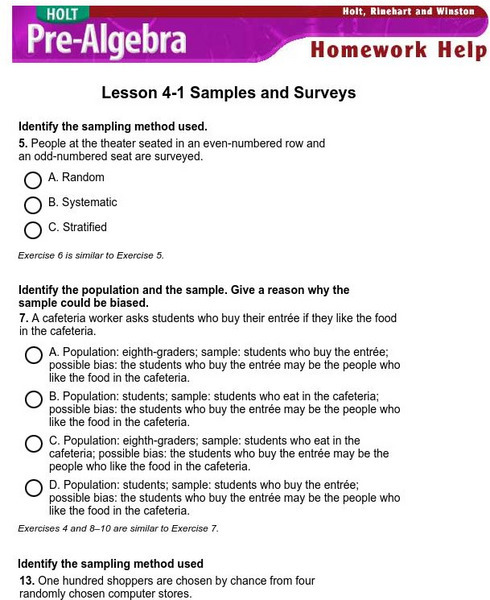
Holt, Rinehart and Winston: Homework Help Independent Practice: Samples and Surveys
Get independent practice working with samples and surveys. Each incorrect response gets a text box explanation and another try. Correct responses are confirmed.
Web Center for Social Research Methods
Research Models Knowledge Base: Selecting Survey Method
Details the following issues that should be considered when selecting the survey method: population, sampling, questionnaire, bias, and administration.
Illustrative Mathematics
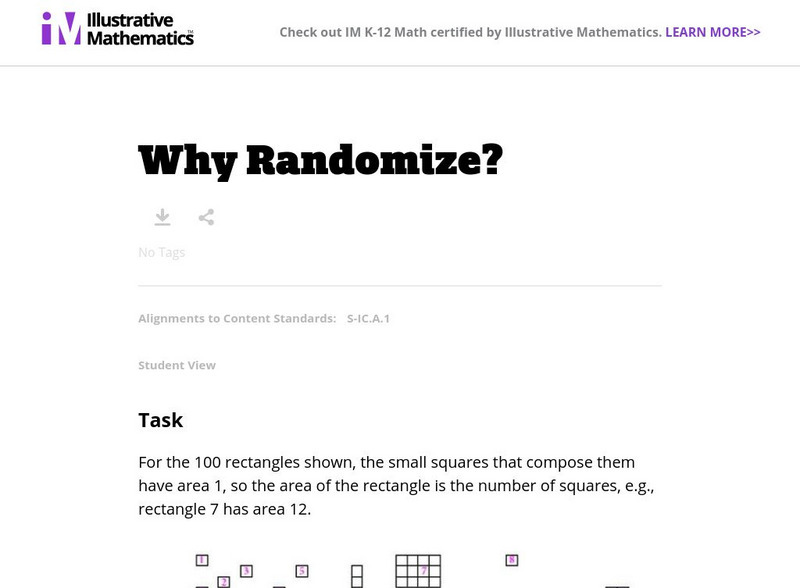
Illustrative Mathematics: S Ic Why Randomize?
The exercise demonstrates that judgment (non-random) samples tend to be biased in the sense that they produce samples that are not balanced with respect to the population characteristics of interest. Young scholars will estimate the mean...


