Illustrative Mathematics
Weather Graph Data
Teaching young mathematicians about collecting and analyzing data allows for a variety of fun and engaging activities. Here, children observe the weather every day for a month, recording their observations in the form of a bar graph....
Curated OER
Weathering Lab
Assist your middle school class with one of the most inclusive weathering and erosion labs available. Individuals use sugar cubes and alka-seltzer to demonstrate the process of physical and chemical weathering. They sketch results...
California Academy of Science
California's Climate
The United States is a large country with many different climates. Graph and analyze temperature and rainfall data for Sacramento and Washington DC as you teach your class about the characteristics of Mediterranean climates. Discuss the...
US Environmental Protection Agency
Weather and Climate: What's the Difference?
Future weather forecasters collect daily temperatures over a period of time. Afterward, they compare their data with monthly averages, as researched on national weather websites, in order to grasp the difference between weather and...
Virginia Department of Education
Weather Patterns and Seasonal Changes
Get your class outside to observe their surroundings with a lesson highlighting weather patterns and seasonal changes. First, learners take a weather walk to survey how the weather affects animals, people, plants, and trees during...
Curated OER
Weather Reporting
Young scholars locate a weather map on the internet and explain or predict the weather for the following day. Students interpret the information on the weather map and pick the correct clothing to wear for that day. Young scholars chart...
Curated OER
Have You Looked Outside? Lesson #5- Graphing Weather Conditions
First graders study daily weather changes. In this weather and graphing lesson, 1st graders chart the daily weather for a month using stickers or weather symbols. They graph the weekly weather so that at the end of the month students...
Curated OER
Weather Data Analysis
In this weather instructional activity, students read a data table comparing the temperature and weather conditions at three different locations. Students use this data to complete 8 fill in the blank, 1 short answer question, and one...
Chicago Botanic Garden
Plant Phenology Data Analysis
Beginning in 1851, Thoreau recorded the dates of the first spring blooms in Concord, and this data is helping scientists analyze climate change! The culminating instructional activity in the series of four has pupils graph and analyze...
Chicago Botanic Garden
Unit 2 Pre-test, Grades 7– 9
This pre-assessment launches a unit on climate change and weather. 15 questions, both short answer and multiple choice, asses the classes' knowledge about these concepts.
Curated OER
Weather Watchers
Students are introduced to an Underground Weather Stations. In groups, they use the internet to research the weather in different parts of the United States locating each city. To end the lesson, they summarize the information they...
DLTK
Groundhog Paper Craft
Get crafty this Groundhog's Day with a hands-on activity that combines creativity and making predictions. Scholars color, cut out, and put together a friendly image of a groundhog and showcase whether they feel the weather will be sunny...
Curated OER
Beary O'Mometer Learns About Careers In Meteorology
Students explore the field of meteorology. In this meteorology instructional activity, students explore weather-related careers as they research the field of study as well as various weather concepts. Students interview meteorologists,...
Curated OER
Mira: Activity 10
Students read the story, Mira and then draw a picture of their favorite weather using the story as a background. They post their pictures around the room and make a tally chart of the number of pictures that were drawn with various...
NOAA
Climographs
In the second lesson plan of a five-part series, young climatologists use provided temperature and precipitation data to create climographs of three different cities. They then analyze these climographs to develop a general...
Curated OER
The Weather Forecast
Students observe a daily paper to see the temperature forecast looking at a paper thermometer with today's predicted temperature colored in. They predict today's temperature, and paste the second color on the same thermometer to show...
Curated OER
Aspects of Weather
Students recognize and observe weather phenomena. In this four part weather lesson, students are introduced to weather symbols through a story, then use a thermometer to measure water temperature. Next, students observe the formation of...
Curated OER
Creating Climographs
Students chart statistical information on graphs, interpret the information and use it to explain spatial relationships, and identify the relationship between climate and vegetation.
Curated OER
Rain Drops Keep Falin' On My Drainage Basin
Students compile information about rainfall, lake elevations and releases of water from Tuttle Creek reservoir into maps, graphs and charts.
Curated OER
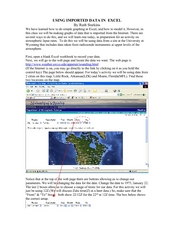
Using Imported Data in Excel
Young scholars import atmospheric data from the internet. In this earth science lesson, students graph the data they collected. They complete the worksheet after the activity.
Curated OER
Why Here? Why Not There?
Students analyze a map and graph information on eleven countries. Using the characteristics of the countries, they determine if they should host the summer or winter Olympic games. After viewing a video, they locate the latitudes of...
Curated OER
The Window
Students read a story entitled, "The Window," and discover how some cultures are rejected by others. Students write a letter expressing feelings of rejection and keep a journal of significant events in the story. Using a graphic...
Curated OER
Let's Take a Chance!
Students investigate probability and the chance of an even happening. In this algebra lesson, students incorporate their knowledge of probability to solve problems and relate it to the real world. They learn to make decisions based on data.
Curated OER
Water Cycle
Third graders observe the changes that occur in the water cycle after doing a water cycle demonstration in a plastic bag. In this water cycle lesson plan, 3rd graders reflect on what they see and identify the stages.


