Curated OER
What's in a Graph?
How many yellow Skittles® come in a fun-size package? Use candy color data to construct a bar graph and a pie chart. Pupils analyze bar graphs of real-life data on the Texas and Massachusetts populations. As an assessment at the end...
Curated OER
Candy Quakes
Eighth graders use candy to show the effects of deformation forces on the earth's crust. In this rock and fossil formation lesson students construct models and simulations to describe and explain natural phenomena.
Curated OER
Flavorful Spreadsheets
Learners create a spreadsheet which includes a bar graph. They sort and classify information and use the average function on a spreadsheet. They research Skittles candy and summarize their findings on a spreadsheet.
Curated OER
Vocational: Candy or Medicine?
Students investigate methods of differentiating between candy, such as Tic Tacs, and actual pills. When caring for children, they discover the importance of keeping all medications, especially those which look like candy, in a safe...
Curated OER
Surveying During a Basketball Game
Tenth graders conduct a survey at a high school basketball game. They compile and present the data as histograms or bar graphs.
Curated OER
Teaching Fractions-Thirds
If you have The Hershey Chocolate Candy Bar book, reading it makes an alluring anticipatory activity for a instructional activity on fractions. Learners use paper cutouts to consider the concept of thirds. The instructional activity...
Curated OER
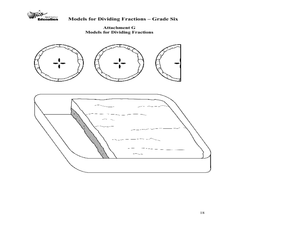
Models for Dividing Fractions
Sixth graders represent division of fractions using manipulatives, such as freezer pops, candy bars, and models such as drawings squares. They develop an algorithm from these examples and solve problems using fractions.
Curated OER
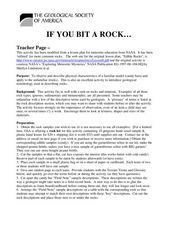
If You Bit A Rock
Students describe the physical characteristics of a familiar model and apply it to an unfamiliar one. In this investigative lesson students become familiar with rock characteristics by participating in a candy bar activity.
Curated OER
Hershey Chocolate Fractions
In order for students to acquire knowledge about math concepts, and in particular fractions, they need concrete ways to practice an abstract concept.¿¿¿ Using Hershey bars builds on prior knowledge as most students have probably...
Curated OER
Half - A Fractions Lesson
First graders explore the fraction half. In this fractions instructional activity, 1st graders watch a video that show the half fraction. They divide a Kit Kat bar in half and do a fraction activity sheet.
Curated OER
Fractions
Students determine that a fraction is a part of a whole or part of a group. They write and read fractions and solve various fraction problems. They create their own fraction problem using colored candies for their classmate to solve.
Curated OER
Sweet Data
Students input data about the colors of their serving of M&M candies onto a spreadsheet. They create charts and graphs based on this information.
Curated OER
Which Graph is best?
Students use commercial software to organize and visually display data to draw conclusions; students use graphing software to create several types of graphs illustrating the number of each color of M&M's in one bag.
Beacon Learning Center
Twix-n-Tween
Yummy! Use Twix candy bars to teach a instructional activity in comparing length! Learners will love this instructional activity and you will be addressing Common Core standards at the same time!
Curated OER
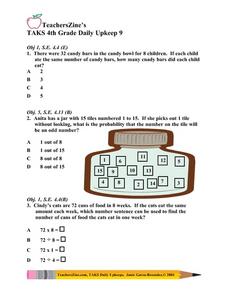
Daily Upkeep 9
For this math worksheet, 4th graders complete a set of word problems where they solve to find the difference number of candy bars. Then, they look at a jar with number tiles and select the probability that the number on the tile will be...
Curated OER
Writing Persuasive Letters
High schoolers write persuasive business letters to candy companies suggesting ways to change their products to make them more enjoyable and increase sales. Prior to writing their letters, they conduct Internet research about the...
Curated OER
Fractions
First graders use Hershey chocolate bars to practice fractions. In this fraction lesson, 1st graders review different fractions and figure out different ways to represent fractions with the pieces of the Chocolate bar. This lesson...
Rational Number Project
Initial Fraction Ideas Lesson 9 Overview
Visual models support young mathematicians with exploring equivalent fractions. Starting with a quick warm-up problem, children go on to work through a series of guiding practice problems before working with a partner identifying and...
Ohio Department of Education
Models for Dividing Fractions - Grade Six
Fifth and sixth graders use food and candy to help them represent division of fractions and develop algorithms to solve fraction problems. They discuss dividing whole numbers by fractions. Pupils use sticks and chocolate bars to...
Curated OER
Probability or Ability?
Students use their non-dominant hand to catch candy which they tossed in the air. They estimate how many they catch in a second round. They record and determine how the probability changed the second time.
Curated OER
Bananas! Bubble Gum! Which One?
Students design and create a graph of data they have collected on their favorite candy bars. They explore how to organize data as well.
Curated OER
Our Favourite Halloween Treat
Students conduct a survey about Halloween candy and create a bar graph illustrating the data. In this data analysis lesson, stud nets are introduced to the topic with a discussion and survey, then the class creates a large graph and...
Curated OER
Build a Skittles Graph
Students construct a bar graph with a given set of data. They calculate the ratio and percent of the data. Students discuss alternate ways of graphing the data as well as multiple strategies to approach the task.
Curated OER
Graphing
Young scholars investigate graphing. In this bar graph lesson, students view an informational website about graphing, then construct a class birthday bar graph outside with sidewalk chalk. Young scholars choose a survey topic, then...
Other popular searches
- Candy Bar Poem
- Candy Bar Math
- Candy Bar Fractions
- Candy Bar Nutrition Label
- Rock Candy Bar Graph
- Candy Bar Economics
- Mars Candy Bar
- Candy Bar Poll
- Candy Bar Life
- Candy Bar Lesson
- Candy Bar Graphs
- Candy Bar Graphing


