Mixing In Math
Mixing in Math: Growing Plants
Whether you have your class plant seeds or begin when sprouts are visible, math skills are used here to predict and track growth over time. Straw bar graphs show plant height on a given day while the graph as a whole shows changes over...
Howard Hughes Medical Institute
Color Variation over Time in Rock Pocket Mouse Populations
A species-specific look at natural selection, the resource herein examines how adaptations have helped the population of rock pocket mice survive in a changing landscape. To begin, middle or high schoolers watch a 10.5 minute video,...
Chicago Botanic Garden
Climate Change Around the World
Look at climate change around the world using graphical representations and a hands-on learning simulation specified to particular cities around the world. Using an interactive website, young scientists follow the provided...
Cornell University
Math Is Malleable?
Learn about polymers while playing with shrinky dinks. Young scholars create a shrinky dink design, bake it, and then record the area, volume, and thickness over time. They model the data using a graph and highlight the key features of...
National Wildlife Federation
Get Your Techno On
Desert regions are hotter for multiple reasons; the lack of vegetation causes the sun's heat to go straight into the surface and the lack of moisture means none of the heat is being transferred into evaporation. This concept, and other...
Curated OER
Rates of Change
In this rate of change worksheet, students read about how to calculate the rate of change in different processes such as plant growth. They are given example problems and practice calculating rates of change.
Rainforest Alliance
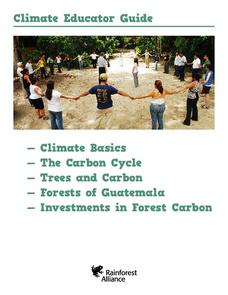
Climate Educator Guide
Climate change is a hot topic in the news. Class members examine carbon dioxide data to analyze trends of our atmospheric makeup over time. They also discuss climate and climate change, and determine how these changes are affecting life...
Curated OER
What Does Time Have to Do with it?
Students investigate time. For this investigative lesson, students run through an obstacle course using standard timers. They record the time and apply this knowledge to problems in math. Students record their predictions, and graph...
Curated OER
Studying Snow and Ice Changes
Students compare the change in snow and ice over a 10 year period. In this environmental science lesson, students use the live data on the NASA site to study and compare the monthly snow and ice amounts on a map of the entire...
Curated OER
The Tilt of the Earth And the Seasons
Fourth graders measure the change in the size of their shadow over time. They visit a fixed structure and record the date, the time, and the measurement of the length of their shadow. They do this over the course of the school year. They...
Growing Minds
Lettuce Exploration
Kathy Henderson’s book And the Good Brown Earth introduces the class to how a vegetables grows and changes over time. They use different types of lettuce to do a close study of this quick-growing vegetable. Learners consider the look,...
Curated OER
Earth's Rotation Changes and the Length of the Day
In this Earth's rotation and day length worksheet, students are given a table with the period of geological time, the age of the Earth and the total days per year. Students calculate the number of hours per day in each geological era,...
Curated OER
Mathematics in Bioengineering: Its Application for Today's Students
High schoolers explore the different fields of bioengineering. They will create and interpret graphs from cancel cells data. They then calculate the amount of drugs found in blood and eliminated by the body over time.
Curated OER
How Many Penguins Does It Take? Studying Carrying Capacity and Limiting Factors
How does a population's habitat determine the size of that population? Teach learners about carrying capacity and limiting factors with an engaging roleplay activity. Class members pose as a colony of penguins who must gather food amidst...
Curated OER
Prairie Populations
Eleventh graders practice the Quadrat Survey Technique to analyze the biodiversity of a local plant community. They compare its biodiversity with the documented changes in biodiversity of the tallgrass prairie over time.
Curated OER
Nutria And The Disappearing Marsh
Young analysts examine changes in the nutria population, vegetation density, and marsh area over time in the wetlands of Louisiana. They import data and use the TI-73 Explorer to graph and analyze the effects of nutria on marsh loss.
Curated OER
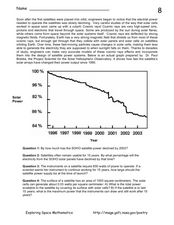
Cosmic Rays and Solar Cells
In this cosmic rays and solar cells worksheet, students read about how cosmic rays damage the electrical output of solar cells over time on satellites. Students use a graph of the solar power output compared to the year for the SOHO...
Captain Planet Foundation
Frog Garden Party! Toads and Triangles in the Math Garden
It's frog party time! With frog banners, frog juice, and a triangle hunt, your garden party is sure to be both entertaining and educational. The lesson connects geometry, earth science, and delicious snacks to teach kids about ecosystems...
Curated OER
Making & Breaking : The Rock Cycle
Students examine the rock cycle and how rocks can change over time. For this geotechnical engineering lesson students draw a diagram of the rock cycle.
PBS
What We Do Adds Up
With so many tons of trash going into landfills each year, your environmentalists can calculate how much the average person is tossing away. This activity has a series of questions not only requiring math, but a conscious thought of how...
Curated OER
Peanut Butter Broccoli - Creating New Produce Through Genetic Selection
Fifth graders understand that traits are inherited and change over time. In this physical traits lesson, 5th graders compare produce items for similar traits. Students create large graphs to show their results. Students discuss genetic...
Curated OER
Let's Make a Compost Cake
Students create a compost cake. In this gardening and decomposition science instructional activity, students review and describe the "nutrient cycle." Students create a compost pile, measure and record the dimensions and temperature of...
Rainforest Alliance
Investments in Forest Carbon
One hundred metric tons of CO2 can accumulate in one acre of forest over time—that's a lot of carbon! In the activity, groups of middle school learners determine what makes forests important. They then solidify the concept by using a...
Curated OER
Math in Science-Radioactive Decay and Half-Life
In this radioactive decay and half-life worksheet, students use given half-lifes to calculate the amount of time it will take for certain amounts of elements to decay. They also find the age of samples and determine how many grams of...


