Regents Prep
Activity to Show Sample Population and Bias
There is bias in many aspects of our lives, and math is no exception! Learners explore provided data to understand the meaning of biased and random samples. The resource includes various data sets from the same population, and...
NASA
The Types of Clouds and What They Mean
Learn to forecast the weather using cloud types. Budding meteorologists identify cloud types and learn to use a dichotomous key. As scholars develop observation and identification skills, they discover how different cloud types cause...
Curated OER
A Research Project and Article For the Natural Inquirer
Get your class to use the scientific process to solve a scientific problem. They utilize the Natural Inquirer magazine to identify a research question which they write an introduction to and collect data to answer. They use graphs,...
Spartan Guides
Infographics Lesson
An infographic is fantastic way for learners to illustrate their understanding of content, express themselves creatively, and teach others in a manner that is both engaging and informative. While originally designed for a lesson on...
Washington State Department of Health
Let's Cook!
Recipes, tasting activities, images of fruits and veggies, fun food facts... you name it, this resource has it! Your class will be cooking up wonderful dishes in no time with these materials. Included here are recipes, handouts,...
Center for Learning in Action
Properties of Balls
Enhance your states of matter lessons with a hands-on science investigation that compares six different balls' color, texture, size, weight, ability to bounce, and buoyancy.
Discovery Education
Discovery Education: Science Fair Central: Investigation Set Up and Collect Data
A brief overview of how to gather both quantitative and qualitative data, complete with a sample data table.
Oswego City School District
Regents Exam Prep Center: Practice With Organizing and Interpreting Data
Several problems are presented to test your skills in creating and interpreting frequency tables, pie charts, box-and-whisker and stem-and-leaf plots.
National Council of Teachers of Mathematics
Nctm: Figure This: Tv Ratings (Pdf)
Here's a challenge for the avid TV watcher. Use your data interpretation skills to explore America's TV watching habits in this NCTM Math Challenges for Families activity. See if you can figure out which night of the week has the...
Math Is Fun
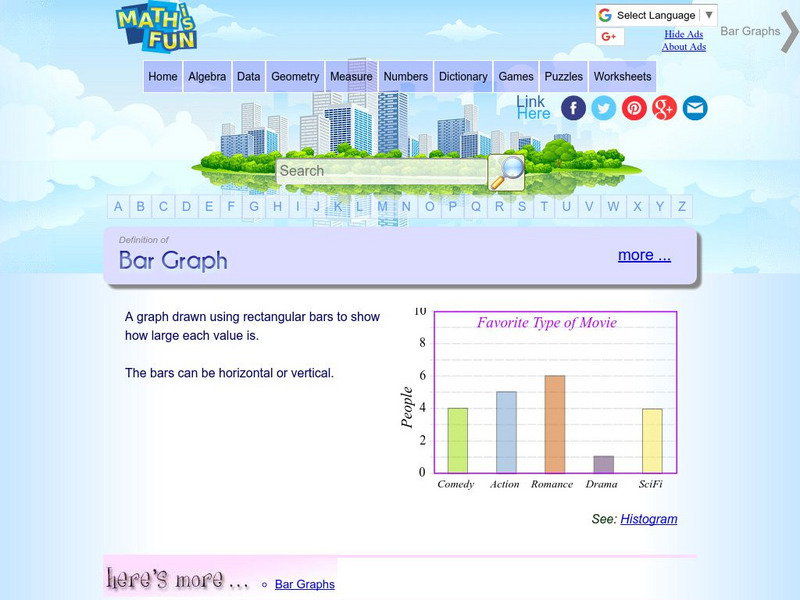
Math Is Fun: Definition of Bar Graph
Get the definition for a bar graph. Then, select the link "here's more" and use the interactive graph to display data as a bar graph, line graph or pie chart. The finished graph may be printed.
National Council of Teachers of Mathematics
Nctm: Figure This: Rose Bowl
A math challenge taken directly from the sports pages. Use your problem solving and data collection aptitude to find out how many different ways a Rose Bowl team could score 11 points. Try this one page activity from the NCTM Math...
BBC
Bbc: Ks1 Bitesize: How to Use Simple Data Tables
Explains how to read information from a simple golf scoring table. Students then label the rows and columns in a 2x3 table. [0:26]
BBC
Bbc Bitesize: Spreadsheets
Spreadsheets are used to store information and data. Once we have our information in a spreadsheet we can run powerful calculations, make graphs and charts and analyse patterns.
Beacon Learning Center
Beacon Learning Center: Leap Frog Experiment
Students design an experiment, collect information using tree diagrams, and interpret the results using charts in this interactive web lesson.
University of Cambridge
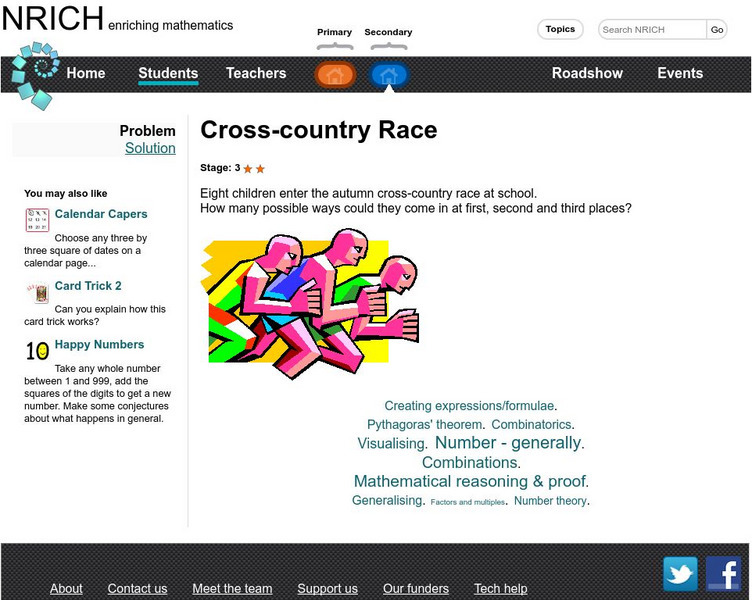
University of Cambridge: Nrich: Cross Country Race
On this one page website sharpen your logic and problem solving skills while working on this challenge. The solution is available to double check your solution.
Scholastic
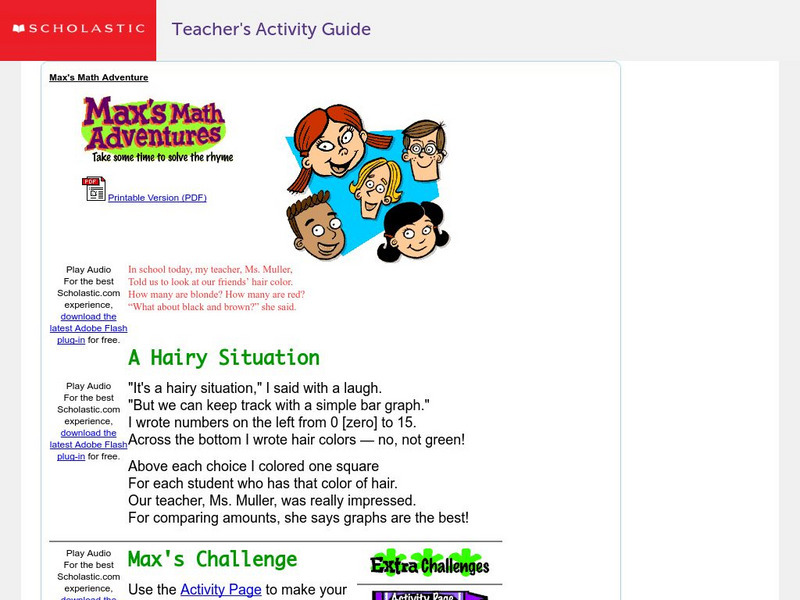
Scholastic: Max's Math Adventures: A Hairy Situation
Help Max make a bar graph to show the hair colors of his classmates. Teachers will appreciate the activities with bar graphs in the extra challenges. Use the teacher's guide to create a fun and engaging lesson.
Texas Instruments
Texas Instruments: Taste Test
Students collect sample data and use the calculator to create pictographs, bar graphs, and pie graphs to demonstrate the favorite brand in the sample data.


