Curated OER
Measuring Mania
Middle schoolers rotate through stations in the classroom, completing different types of measurements. These measurements are placed into a spreadsheet, and a scatter plot is generated. They type an explanation of their results in...
Curated OER
Phenomenal Weather-Related Statistics
Eighth graders research, collect and interpret data about weather statistics. They record that data on spreadsheets. they create Powerpoint presentations on their individual or group research.
Curated OER
Math Made Easy
Students evaluate word problems. In this problem solving lesson, students are presented with word problems requiring graphing skills and students work independently to solve.
Curated OER
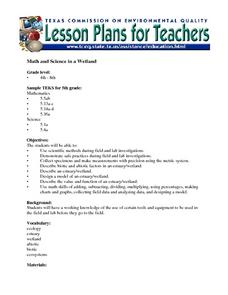
Math and Science in a Wetland
Students describe safe practice when doing field and lab investigations in a estuary or wetland. They create a model of an estuary and describe their value and function. They participate in field study in which they collect and analyze...
Curated OER
Energy Choices
Students add and multiply decimals to complete gas choice worksheets. They discover which gas supplier has the best gas prices. Students collect and interpret data about local natural gas suppliers and use this information...
Curated OER
A Day at the Beach
Student read Sheryl Wilson's story, "A Day at the Beach" while classifying items they find. They design a chart of the items before using educational graphing software to create a graph.
Curated OER
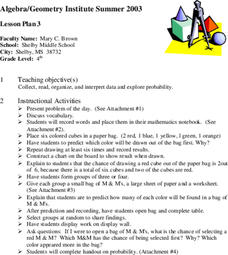
Exploring Probability
Fourth graders participate in a lesson that explores probability. They use candy and model cubes to experiment with different outcomes that can be charted if the students can proceed to the objective of the lesson. They discover how...
EngageNY
From Ratio Tables, Equations and Double Number Line Diagrams to Plots on the Coordinate Plane
Represent ratios using a variety of methods. Classmates combine the representations of ratios previously learned with the coordinate plane. Using ratio tables, equations, double number lines, and ordered pairs to represent...
Teach Engineering
What a Drag!
Stop and drop what is in your hand! Pupils investigate how form effects drag in the 12th part of a 22-part unit on aviation. Groups create equally weighted objects and determine which one falls the fastest by collecting data.
Curated OER
Vernier - A Speedy Slide with EasyData™ App and CBR 2™
Mathematicians use a CBR 2™ motion detector to determine their speed or velocity going down a playground slide. They also experiment with different ways to increase their speed going down the slide. Finally, students complete the Student...
EngageNY
Scatter Plots
Scholars learn to create scatter plots and investigate any relationships that exists between the variables with a activity that also show them that statistical relationships do not necessarily indicate a cause-and-effect relationship.
Howard County Schools
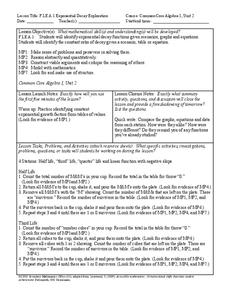
Exponential Decay Exploration
How can you model exponential decay? Explore different situations involving exponential decay functions and decreasing linear functions by performing activities with MandM candy, popcorn kernels, and number cubes.
Radford University
Population Project
How fast does it grow? Scholars work on two tasks dealing with exponential growth, one on population growth and the second on investments. Learners research a country's population over the past century and make predictions of the current...
Curated OER
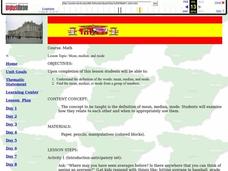
Mean Median and Mode
Young scholars collect data, graph it and analyze it. In this statistics lesson, students plot their data and calculate the mean, median and mode explaining how it relates to the data. They define the ways to find the mean, median and mode.
Curated OER
Magnetic Storms
In this magnetic storms worksheet, students use a graph of data collected over time showing the magnitude of a magnetic storm. Students use the data to solve 6 problems about the graph and they determine the strength of the storm at...
Curated OER
Making Paper
Students explore paper making. For this cross curriculum multicultural ecology and art lesson, students follow written and oral instructions to make paper using common household items. Students predict the amount of paper use in their...
Curated OER
The Apple Orchard Problem
Students explore various approaches to solving a problem of maximizing the total production of apples in an orchard. In this apple orchard instructional activity, students collect data in order to solve the apple orchard problem...
Curated OER
The Vitruvian Theory - Does It Apply to You?
Students explore the concept of the Vitruvian theory. In this Vitruvian theory lesson plan, students collect data from their classmates about their arm span and height. Students compare their ratios of arm span to height with Leonardo...
Curated OER
Livelihood of the Times
Students recognize the importance of analyzing historical information and data. In this historical analysis lesson, students collect information for a bar graph, complete a jobs worksheet and define vocabulary.
Curated OER
Is There Ice on Mercury?
In this ice on Mercury worksheet, students read about the data collected from the NASA Messenger and the Arecibo Radio Telescope indicating the possibility of ice on Mercury. Students solve 6 problems including finding the scale of the...
Curated OER
Contaminated Drinking Water
Students predict, experiment, and draw conclusions about the safety of drinking water. In this ecology lesson, students participate in an experiment to determine if they can taste or see contamination in drinking water. Data is collected...
Curated OER
3 Kinds of Graphs
Students construct three different graphs-a line graph, a bar graph, and a circle graph. In this graphing instructional activity, students use different graphs to display various data that they collect.
Curated OER
West Nile Virus and Lyme Disease: Making Sense of the Numbers
In an interdisciplinary exploration, trace the development of West Nile fever and Lyme diseases. Pupils discover how these diseases are contracted. They collect statistical data and analyze trends.
Curated OER
How is Your Driver Doing?
Sixth graders explore the concept of averaging of numbers and the function of a spreadsheet. Data is collected, analyzed, and displayed in this lesson. The NASCAR race results provides the basis for the collection of data.


