Statistics Education Web
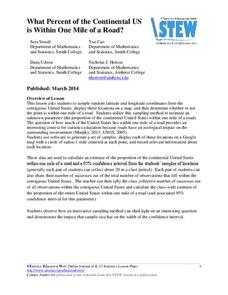
What Percent of the Continental US is Within One Mile of a Road?
There are places in the US where a road cannot be found for miles! The lesson asks learners to use random longitude and latitude coordinates within the US to collect data. They then determine the sample proportion and confidence interval...
University of Georgia
Heating and Cooling of Land Forms
Compare heating and cooling rates of different land forms. A lab activity has groups collect data on the rate of heating and cooling of soil, grass, saltwater, fresh water, and sand. An analysis of the rates shows how the different land...
LABScI
Circulation and Respiration: Vital Signs
What do your vital signs tell your doctor? An engaging hands-on lesson has your learners monitor their own lung capacity, blood pressure, and heart rate. They then connect the vital measures to the workings of the circulatory and...
Zip Grade
ZipGrade
Imagine using your smart phone or tablet to grade a class set of quizzes in less than a minute. Imagine getting immediate results and being able to give immediate feedback. No hunting for scantrons. No waiting in line for the scantron...
Radford University
The Science of Surveys
To drill or not to drill? An informative unit has scholars first research the advantages and disadvantages of oil drilling in Alaska. They set up and conduct a sample survey to assess attitudes toward oil drilling in a specific...
Curated OER
Interpreting Position vs. Time Graphs (Still Pretty Basic Stuff)
This is an interactive physics slide show that quizzes viewers about position versus time. It is set up as a series of 10 questions to answer: a graph with a questions slide followed by an answer slide. This is terrific practice in graph...
STEM for Teachers
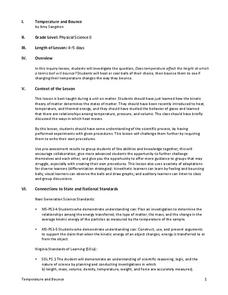
Temperature and Bounce
Take part in a fun experiment and hold an impromptu bouncing contest with your class. Young scientists heat and cool balls before bouncing them to determine whether temperature changes affect how they bounce. The set of...
EngageNY
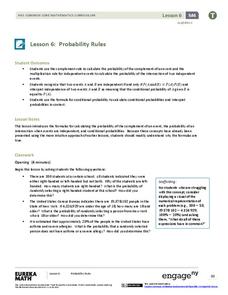
Probability Rules (part 1)
In statistics, probability rules—literally! Learners use their previous knowledge and explore a set of rules for conditional probability, independent probability, and complements. Given different scenarios, they must determine what type...
Mathematics Assessment Project
Middle School Mathematics Test 3
Real-life mathematics is not as simple as repeating a set of steps; pupils must mentally go through a process to come to their conclusions. Teach learners to read, analyze, and create a plan for solving a problem situation. The...
Curated OER
Learn How to Graph
Students examine various types of charts and discover how to construct a line graph. Using graph paper, they construct a graph displaying weight loss over a five-year period. They draw copnclusions from the completed graphs.
Curated OER
Snow Cover By Latitude
Students examine computerized data maps in order to create graphs of the amount of snowfall found at certain latitudes by date. Then they compare the graphs and the data they represent. Students present an analysis of the graphs.
Curated OER
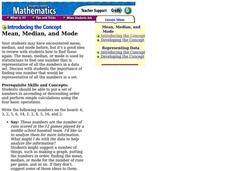
Mean, Median, and Mode
Pupils calculate the mean, median, and mode in a set of numbers. In this data analysis activity, students put a set of numbers in ascending order and perform calculations to find the mean, median, and mode.
Curated OER
Sunspot Graphing
Students, using 15 years of sunspot data, plot data on a classroom graph. They discuss why the pattern from their individual sheets did not and could not match the class graph.
Curated OER
Min-Max temperatures
Learners investigate data of minimum and maximum weather temperatures over the period of one week. They answer guided questions in order to establish comprehension of interpreting the data.
Curated OER
Real Estate Lesson: Monthly Payments
Students examine real-world data relating to real estate. They conduct Internet research, record data regarding real estate in major cities, graph the data, calculate mortgage payments using a mortgage calculator, and analyze the data.
Curated OER
Live, From New York
In this data analysis worksheet, students study the information on a data table about the hosts of Saturday Night Live. Students answer 8 problem solving questions about the table.
Curated OER
Making Data Meaningful
In this sample mean activity, students explore different ways "average" is used. Students use this information to find the sample mean of the height of a large class of students. Students find the mean, median, mode and range of two sets...
Curated OER
Alien Plant Invasion: A Filed Study project at Saguaro National Park
Students are able to describe the purpose of National Parks and Monuments. They describe three ways alien plants species affect native populations of plants and animals. Students are able to properly set up a study plot, measure and...
Curated OER
Find the Mean #6
In this find the mean #6 worksheet, 5th graders find the mean for 6 sets of numbers and write it in the box.
Curated OER
Find the Mode #3
For this find the mode #3 worksheet, 5th graders find the mode for 6 sets of numbers and write it in the box.
Curated OER
Range, Mean, Median, and Mode
Eighth graders find the range, median, mean, and mode of a data set. In this finding the range, median, mean, and mode of a data set lesson, 8th graders collect data about the high and low temperature for 10 different cities. ...
Curated OER
Choose an Appropriate Graph
In this graphs worksheet, students solve 6 fill in the blank problems where they choose the most appropriate type of graph for each set of data and explain why they chose that type. Students use bar graphs, histograms and circle graphs....
Curated OER
Fitness Analysis
Students study how to monitor their personal status of their body composition. They study how to monitor and adjust activity levels to meet personal fitness needs and demonstrate objectives 1 and 2 by using the software provided by Furtex.
Curated OER
Measures of Central Tendency
In this Algebra I worksheet, 9th graders determine the measures of central tendency for a given data set. The one page worksheet contains four problems. Answers are provided.
Other popular searches
- Comparing Two Data Sets
- Comparing Sets of Data
- Comparing Related Data Sets
- Comparing Two Sets of Data


