Shodor Education Foundation
Regression
How good is the fit? Using an interactive, classmates create a scatter plot of bivariate data and fit their own lines of best fit. The applet allows pupils to display the regression line along with the correlation coefficient. As a final...
Shodor Education Foundation
Scatter Plot
What is the relationship between two variables? Groups work together to gather data on arm spans and height. Using the interactive, learners plot the bivariate data, labeling the axes and the graph. The resource allows scholars to create...
Shodor Education Foundation
Vertical Line Test
Connect the points to create a function. Using points given by the applet, pupils try to connect them to create a line that would pass the vertical line test. The resource keeps track of the number of sets the learner is able to identify...
Shodor Education Foundation
Simple Monty Hall
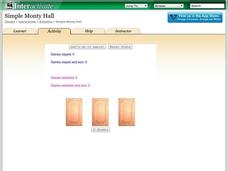
What's behind door number one? A fun resource lets learners simulate the classic Monty Hall probability problem. Pupils choose a door, and after they select a losing door, they decide whether to switch or stay. Using their decisions, the...
Shodor Education Foundation
Overlapping Gaussians
Adjust the overlap to compare probabilities. Using sliders, learners adjust the shape of two Gaussian curves. The interactive calculates the area of the left tail for one curve and the right tail for the other. Pupils set the interactive...
Shodor Education Foundation
Rabbits and Wolves
A change in a parameter can end in overpopulation. The resources gives pupils the opportunity to control the parameters of rabbits and wolves in a natural setting. Using the set parameters, the simulation runs and displays the population...
Shodor Education Foundation
Spread of Disease
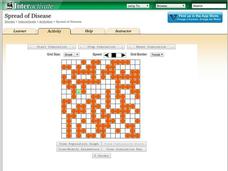
Control the spread of a contagious disease. An applet allows pupils to run a simulation on the spread of a disease. Rules govern how the disease is spread and the length of time it takes to recover. Learners view the spread visually and...
Shodor Education Foundation
Two Colors Applet
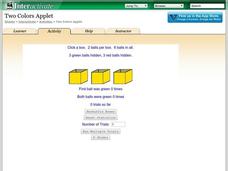
Find the box with two green balls. The applet uses six balls, three green and three red, and hides them in three boxes. Pupils choose a box and click on it to reveal the color of balls inside. Using the chosen box, the simulation keeps...
Shodor Education Foundation
Squaring the Triangle
Teach budding mathematicians how to square a triangle with an interactive that shows a graphical proof of the Pythagorean Theorem. Pupils alter the lengths of the legs using sliders. Using the inputted lengths, the applet displays the...
Shodor Education Foundation
Pythagorean Explorer
Make sure the measurement is right. The interactive provides right triangles with a missing side measurement. Pupils use the given sides and the Pythagorean Theorem to calculate the length of the missing side. After entering the length,...
Shodor Education Foundation
Normal Distribution
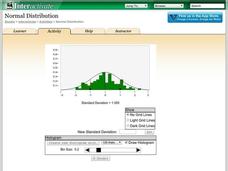
Does the size of the bin matter? The resource allows pupils to explore the relationship between the normal curve and histograms. Learners view histograms compared to a normal curve with a set standard deviation. Using the interactive,...
Shodor Education Foundation
Multi-Function Data Flyer
Explore different types of functions using an interactive lesson. Learners enter functions and view the accompanying graphs. They can choose to show key features or adjust the scale of the graph.
Shodor Education Foundation
Multiple Linear Regression
You'll have no regrets when you use the perfect lesson to teach regression! An interactive resource has individuals manipulate the slope and y-intercept of a line to match a set of data. Learners practice data sets with both positive and...
Shodor Education Foundation
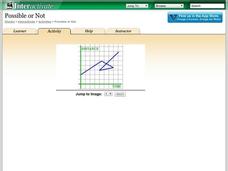
Possible or Not?
What does the graph mean? Pupils view 10 graphs and determine whether they are possible based on their contexts. The contexts are distance versus time and profit versus time.
Partnership for Educating Colorado Students
Mayan Mathematics and Architecture
Take young scholars on a trip through history with this unit on the mathematics and architecture of the Mayan civilization. Starting with a introduction to their base twenty number system and the symbols they used, this eight-lesson unit...
Noyce Foundation
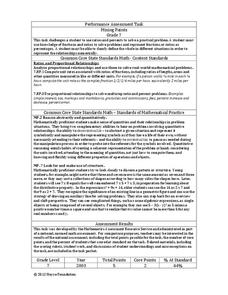
Mixing Paints
Let's paint the town equal parts yellow and violet, or simply brown. Pupils calculate the amount of blue and red paint needed to make six quarts of brown paint. Individuals then explain how they determined the percentage of the brown...
EngageNY
Decimal Expansions of Fractions, Part 2
Develop your pupils' understanding of fractions and their decimal equivalence using the 12th lesson in this series. Scholars learn an alternative to long division that results in converting fractions to decimals that emphasize fractional...
Shodor Education Foundation
From Probability to Combinatorics and Number Theory
What middle schooler does not enjoy an occasional online game? In this lesson play, you will find embedded links to an online probability game, and informative pages about how division is used in probability, the concept of tree models,...
Curated OER
"Eggs-ploring" Math with Jellybeans
Learners work in pairs with a small bag of jellybeans to estimate the number of candies in their bags and then figure out how many groups of 10 jellybeans are contained in their bags. They then graph the information using a pictograph or...
Alabama Learning Exchange
Exponents and Division
Create a human fraction to learn about division of exponents. Scholars develop the rule for division of exponents by being part of a human fraction to explore and justify the rule. They also consider zero exponents and negative exponents.
Achieve
Fences
Pupils design a fence for a backyard pool. Scholars develop a fence design based on given constraints, determine the amount of material they need, and calculate the cost of the project.
Achieve
Corn and Oats
How much land does a parcel hold? How much fertilizer does it take for a field of corn? Pupils answer these questions and more as they apply ratio reasoning and unit analysis.
Achieve
Yogurt Packaging
Food companies understand how to use math to their advantage. Learners explore the math related to the packaging and serving size of yogurt. They then use unit analysis and percent values to make decisions on the product development.
Curated OER
Take It To the Bank
Examine how the economics of a school store relate to real world economics. Elementary students explore various websites, complete a Venn diagram, create a schedule of wages for the students, read the book "A Chair For My Mother" and...


