Curated OER
Illinois Wild
Sixth graders identify different animals native to Illinois. They research a specific animal to study more about its characteristics, examine what makes a habitat, and recognize the difference between a food web and food chain.
Curated OER
ABC and 1-2-3 Farming
Students demonstrate how to alphabetize animal names. In this word study lesson, students identify animals that live on the farm and conduct a favorite farm animal survey. Students order animal pictures in alphabetical order.
NOAA
Mapping the Ocean Floor: Bathymetry
Bathymetry is not a measure of the depths of bathtubs! Through the three lessons, scholars explore two different types of maps and how they are made. The resource focuses on topographic and bathymetric maps and teaching the techniques...
Cornell University
Sound Waves
How does sound travel through different mediums? Scholars explore this question by creating and observing sound waves as they learn the difference between transverse and longitudinal wave motion. Using their new knowledge, class members...
Cornell University
Sound Off!
Time to witness the effects of sound. Learners analyze different materials to determine their abilities to absorb sound waves. They use free software to monitor the amplitude of the waves to verify results.
Science Matters
That’s An Otter Story
Young scientists discover how sea otters' habitats have changed due to human impact. Through conversation, video observation, and story reading, scholars identify how human interactions change a specific ecosystem in both positive and...
California Academy of Science
Sustainable Water Solutions: Weighing the Pros and Cons
Switching indoor water fixtures to low flow reduces water usage by more than 45 percent. This and other solutions to reduce water usage have both pros and cons. Scholars view videos of different solutions, discuss them in small groups,...
California Academy of Science
Rapid Brainstorming: How Can We Improve Our Global Food System?
In 2018, the average fast food burger cost $2.64 while a salad averaged $4.14. Does the price difference matter to public health? Scholars consider that question and others in a brainstorming session about improving our global food...
Curated OER
Why Can’t I Have Sugar? All About Diabetes
Begin the lesson by having your class write what they know about diabetes. They learn through a skit how the body metabolizes glucose. A visual representation of the two types of diabetes is displayed, and then learners participate in...
Curated OER
Digital Video Lesson Plan: Brine Shrimp
Students participate in classroom experiment to gain better understanding of type of environment brine shrimp can best survive. Students then explore effects of common saltwater pollutants on survival of animals in sea.
Curated OER
In My Opinion
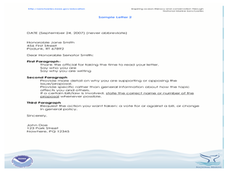
Young writers craft letters to the government stating their opinion on different topics. They pick an environmental or ocean issue, research it, and craft their formal persuasive letter. Ensure your learners include supporting facts and...
National Earth Science Teachers Association
The Earth Scientist Project
Pairs of learners choose an earth scientist from an extensive list. They collect information by researching online or in books about the childhood, education, and major contributions made by their chosen scientist. When they present...
Teach Engineering
Biomes and Population Dynamics - Balance Within Natural Systems
How large can a population become? The fifth installment of a nine-part unit teaches young ecologists about limiting factors that determine the carrying capacity of species in the Sonoran Desert. Here is a PowerPoint to help present this...
Curated OER
Microscope Mania
Students examine parts of a microscope and how to use a microscope at five lab stations. They identify parts of a microscope by describing the differences between low power and high power. They visit Internet sites (included in the...
Polar Trec
What Is My Footprint?
How do one's habits and lifestyle choices affect the environment? Through a short online survey, learners will calculate their own carbon footprints then determine how to reduce their impact on the environment through simple steps, such...
Polar Trec
Temperature Profile above the South Pole
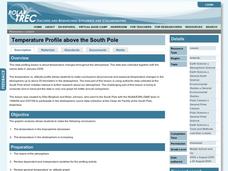
Collecting and understanding data is a big part of understanding the world and how it changes. To better grasp what temperatures are changing and how they affect global populations, learners create a graph based on the date provided....
Chicago Botanic Garden
Plant Phenology Data Analysis
Scientists monitor seasonal changes in plants to better understand their responses to climate change, in turn allowing them to make predictions regarding the future. The last activity in the series of six has scholars analyze BudBurst...
Science Matters
Earthquake Building/Shaking Contest
Japan is one of only a handful of countries that constructs buildings that are almost earthquake proof. The 13th instructional activity in the 20-part series challenges scholars to build structures to test against earthquakes. With...
National Nanotechnology Infrastructure Network
Hiding Behind the Mask
Microchips are a man-made wonder. Investigate the manufacturing wonder with a hands-on inquiry-based instructional activity. Scholars simulate the process of pattern transfer using photoresist. Their conclusion identifies how their...
PHET
The Earth as a Magnet
Everyone loves playing with magnets and iron filings. Here, young scientists first observe and then participate in an activity demonstrating magnetic fields. After completing their observations, they apply this knowledge...
Curated OER
Storm Clouds-- Fly over a Late Winter Storm onboard a NASA Earth Observing Satellite
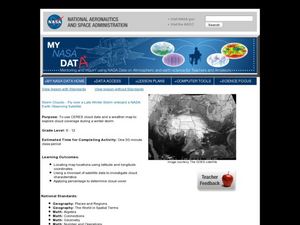
Students study cloud data and weather maps to explore cloud activity. In this cloud data lesson plan students locate latitude and longitude coordinates and determine cloud cover percentages.
Curated OER
A Comparison Study of Water Vapor Data to Precipitation over North America
Students use NASA satellite data to compare water vapor over the United States. In this data analysis instructional activity students use an Excel spreadsheet to map their data.
Laboratory for Atmospheric and Space Physics
Charting the Progress of New Horizons
In 2006, New Horizons began its mission to fly to Pluto. As it continues its journey, scholars track its progress with the help of an informative website, all the while reinforcing measurement concepts with the construction of a scaled...
Curated OER
Remember This?
Learners investigate the mechanics of an fMRI and the properties of neurons. In this biology lesson, students analyze the way the brain works by performing tests in the neurons in the brain. This is all done theoretically.
Other popular searches
- Computer Science Excel
- Computer Science Java
- B Ed Computer Science
- History of Computer Science
- Computer Science History
- Computer Science Worksheets
- Networking Computer Science
- Computer Science C Programs
- Computer Science C++programs
- Computer Science Engineering
- Science and Computer Science
- Computer Science Terms


