Skyscraper Museum
Changes in a City Over Time
Investigate the growth and development of New York City with the final lesson in this four-part series on skyscrapers. Learners first explore the concept of urban growth by looking closely at a series of three paintings made of Wall...
EngageNY
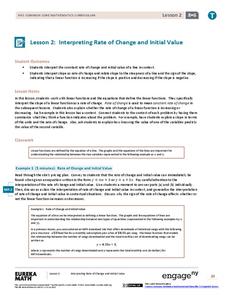
Interpreting Rate of Change and Initial Value
Building on knowledge from the previous lesson, the second lesson in this unit teaches scholars to identify and interpret rate of change and initial value of a linear function in context. They investigate how slope expresses the...
Science Geek
Phase Changes
Examine the energy transfer of phase changes through diagrams. The second slide show in a series of seven presents the information related to energy and phase changes. It includes the effect of pressure on phase changes.
EngageNY
Graphs of Linear Functions and Rate of Change
Discover an important property of linear functions. Learners use the slope formula to calculate the rates of change of linear functions. They find that linear functions have constant rates of change and use this property to determine if...
Chicago Botanic Garden
Migration, Adaptation, and Changing Climates
It is easy for humans to adapt to changing environments, but how do animals and plants do it? Classes discuss how plants and animals deal with environmental changes in the second of seven lessons. Through questions and discussions,...
Mr. E. Science
Changes in Matter
Do solids, liquids, and gases even matter? The presentation focuses on changes in matter, including phases, Boyle's Law, Charles' Law, and physical changes.
EngageNY
Average Rate of Change
Learners consider the rate of filling a cone in the 23rd installment of this lesson series. They analyze the volume of the cone at various heights and discover the rate of filling is not constant. The lesson ends with a discussion of...
West Contra Costa Unified School District
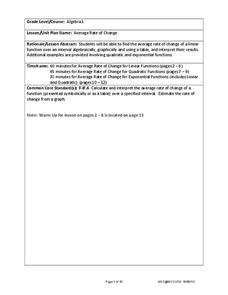
Average Rate of Change
Learners investigate average rates of change for linear functions and connect the concept to slope. They then determine average rates of change in quadratic and exponential functions.
EngageNY
Constant Rates Revisited
Find the faster rate. The resource tasks the class to compare proportional relationships represented in different ways. Pupils find the slope of the proportional relationships to determine the constant rates. They then analyze the rates...
Howard County Schools
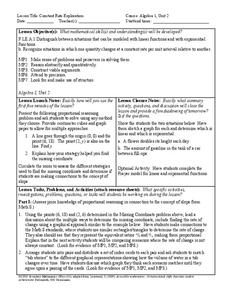
Constant Rate Exploration
Question: What do rectangles and bathtub volume have in common? Answer: Linear equations. Learn how to identify situations that have constant rates by examining two different situations, one proportional and one not proportional.
NOAA
Communicate!: Create a Unique Message About Climate Change
Scholars use their communication skills to express their take on climate change in the ninth installment of the 10-part Discover Your Changing World series. They create ways to deliver their messages on a specific aspect of climate by...
NASA
Resolving 2-Plane Traffic Conflicts by Changing Speed—Problem Set E
What do you do to change arrival times of airplanes when a different route is not available? The fifth interactive in a series of six presents problems where pupils must find solutions to conflicts of safety rules. They must decide how...
EngageNY
Changing Scales
Pupils determine scale factors from one figure to another and the scale factor in the reverse direction. Scholars compute the percent changes between three figures.
Virginia Department of Education
Changes in Ecosystems
How does water pollution affect the environment? Provide your class with the resources to answer this question as they learn about eutrophication and ecosystem changes. Over two weeks, they simulate the effects of pollution on the...
Curated OER
Properties of Matter
This PowerPoint is a gem! Seventy-eight slides present an entire introduction to matter in bullet-point fashion. Viewers learn about everything from mass and inertia to phase changes and gas laws! The only glitch is that the links to...
Curated OER
Climate Change Challenge
Students participate in a demonstration in which they role-play polar bears and habitat components to demonstrate the impacts of climate change on the Arctic Ocean ecosystem.
Curated OER
Rates of Change
In this rate of change worksheet, students read about how to calculate the rate of change in different processes such as plant growth. They are given example problems and practice calculating rates of change.
Curated OER
The Climate Change Skeptic's Argument: Natural Solar Cycles or Human Activity?
Teachers explore patterns in sunspots and total solar irradiance to understand the counterpoint to the human effect of global warming. In this professional development tool, teachers work through a lesson on the sun's natural patterns to...
Curated OER
Rate of Change
High schoolers observe and calculate slopes. In this algebra lesson, students graph equations and determine the pace at which the slope is changing. They use the navigator to see the change as they graph the lines around.
Curated OER
2002 U.S. National Chemistry Olympiad National Exam - Part I
As to be expected from the American Chemical Society Olympiad Examinations Task Force, this 60-question test tops the charts in terms of excellence. It consists entirely of multiple choice questions designed to assess a year's worth of...
West Contra Costa Unified School District
Average Rate of Change
The concept of slope gets an approachable, yet theoretical, treatment in a comprehensive algebra lesson. The use of functional notation and problem-solving techniques keep the material rigorous, but detailed teaching notes and lots of...
Illustrative Mathematics
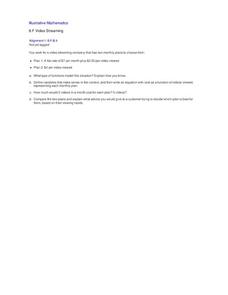
Video Streaming
Your movie fans will be interested in this resource. They will compare video streaming plans. One plan charges a set rate per month and a reduced viewing fee, and the other has a flat rate per each video viewed. Unfortunately, students...
Mathalicious
On Your Mark
With many factors leading to a great athlete, does height make Usain Bolt unfairly fast? Middle schoolers conduct analysis to change the running distance of the Olympic races to be proportional to the height of the participants. They...
US Geological Survey
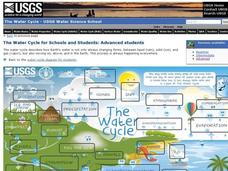
The Water Cycle for Schools: Advanced Ages
Explore the water cycle in an interactive diagram of the process. The diagram shows how water is a moving system and constantly changing forms. The resourc includes vocabulary words that pupils click on in order to discover more about...


