Kenan Fellows
How Does an Unhealthy Diet Influence our Health and Well-Being?
You are what you eat, or so they say! After surveying family and friends on a week of eating habits, learners analyze the data for patterns. They compare different variables such as fats and cost, fats and calories, or fats and LDLs.
College Board
Engaging the Intuition in Statistics to Motivate
Motivation is key to learning. The author points out that it is important to engage intuition for aspects of statistics that pupils find counter-intuitive. Three strategies—using multiple representations, using intuitive analogies, and...
Curated OER
What's Your Hypothesis?
Find the article, "In the Thick of Air Pollution," not through the resource link in the instructional activity, but through an Internet search. Have high schoolers read it and perform calculations with the statistics provided. The...
Curated OER
Negative and Positive Numbers
Help scholars explain the concept of positive and negative numbers. Here you will find three separate activities that will help them to correlate positive and negative numbers with real life. Note: Activities require that the teacher...
Curated OER
Count the Animals
Primary graders count the number of pigs, horses, cows, elephants, and giraffes pictured (1-5). They write the numeral that represents how many of each are shown in boxes labeled with single examples of the animal. In addition to writing...
Curated OER
Lucky Leprechaun Multiplication
A leprechaun in the corner gives a festive feel to this set of single-digit multiplication problems. Although there isn't much to correlate these equations to the St. Patrick's Day theme, the image and title make this more fun than a...
Curated OER
Linear and Exponential Models
Learners linearize data to determine if an exponential model is suitable. In this linearizing data to determine if an exponential model is suitable lesson, students graph the residuals of sets of data that appear to have an exponential...
Curated OER
Using Excel to Reference and Graph Live Data from a Web Site
Students collect live buoy data about water temperatures in the Gulf of Mexico from the Internet and work individually to organize their data and create a line graph using Excel Spreadsheet. Students analyze their data and examine any...
Curated OER
Frog and Toad are Friends
Students view a 30-minute video lesson to discover information about the characteristics of frogs and toads. They then transform themselves into frogs and participate in a Jumping Frog Jubilee. They work in groups of three to measure and...
Curated OER
Related Data Sets
In this algebra worksheet, 11th graders describe correlation between the different data. They describe the situation that is not a casual relationship. There is and answer key to this problem.
Curated OER
Is there Treasure in Trash?
More people, more garbage! Young environmentalists graph population growth against the amount of garbage generated per year and find a linear model that best fits the data. This is an older resource that could benefit from more recent...
Curated OER
Line of Best Fit
In this line of best fit worksheet, students solve and complete 8 different problems that include plotting and creating their own lines of best fit on a graph. First, they study the samples at the top and plot the ordered pairs given on...
Curated OER
How Many Frogs?
Students explore the concept of linear regression. In this linear regression lesson, students find the line of best fit for a set of data pertaining to a frog population. Students use their line of best fit to predict the frog population...
American Statistical Association
You and Michael
Investigate the relationship between height and arm span. Young statisticians measure the heights and arm spans of each class member and create a scatter plot using the data. They draw a line of best fit and use its slope to explain the...
American Statistical Association
How Tall and How Many?
Is there a relationship between height and the number of siblings? Classmates collect data on their heights and numbers of brothers and sisters. They apply statistical methods to determine if such a relationship exists.
Math Moves U
Collecting and Working with Data
Add to your collection of math resources with this extensive series of data analysis worksheets. Whether your teaching how to use frequency tables and tally charts to collect and organize data, or introducing young mathematicians to pie...
EngageNY
Conditional Relative Frequencies and Association
It is all relative, or is it all conditional? Using an exploration method, the class determines whether there is an association between gender and superpower wish through the use of calculating conditional relative frequencies. The last...
EngageNY
End-of-Module Assessment Task - Algebra 1 (Module 2)
Check for understanding at the end of your descriptive statistics unit with an end-of-module assessment. It uses five questions to measure progress toward mastery of descriptive statistics standards. Each question is developed to address...
Mathematics Assessment Project
Bird’s Eggs
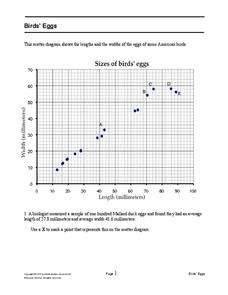
Are the length and width of birds' eggs related? Young ornathologists use a scatter plot to investigate the relationship between the length and width of eggs for Mallard ducks. They then determine the egg with the greatest...
Education Development Center
Geography of the Coordinate Plane
Put the graph into graphing and allow learners to understand the concept of point plotting and how it relates to data. The worksheet provides a nice way to connect data analysis to a graph and make predictions. The worksheets within the...
EngageNY
Scatter Plots
Scholars learn to create scatter plots and investigate any relationships that exists between the variables with a activity that also show them that statistical relationships do not necessarily indicate a cause-and-effect relationship.
EngageNY
Patterns in Scatter Plots
Class members investigate relationships between two variables in the seventh installment of a 16-part module that teaches scholars how to find and describe patterns in scatter plots. Young mathematicians consider linear/nonlinear...
EngageNY
Informally Fitting a Line
Discover how trend lines can be useful in understanding relationships between variables with a lesson that covers how to informally fit a trend line to model a relationship given in a scatter plot. Scholars use the trend line to make...
EngageNY
Mid-Module Assessment Task: Grade 8 Module 6
Make sure pupils have the skills to move on to the second half of the module with a mid-module assessment task. The formative assessment instrument checks student learning before moving on to the rest of the lessons in the unit.
Other popular searches
- Negative Correlation
- Number Correlation
- Coefficient of Correlation
- Correlation Coefficients
- Linear Correlation
- Analyzing Correlations
- Correlation of Data Sets
- Math Teks Correlation
- Scatterplots and Correlation
- Scatter Plots and Correlation
- Correlation and Causation
- Statistics Correlation


