Curated OER
M&M Math
Students research number values by participating in a candy exercise. In this math function lesson, students utilize baking ingredients to create cookies and multiply how many M&M's will go into the batch if you want a certain amount...
Curated OER
Classification Introduction
Learners simulate classifying rocks using different colored skittles. In this earth science lesson, students create a Venn diagram according to their compiled information. They share this diagram in the class.
Curated OER
Graphing With Paper and Computers
Fourth graders construct bar graphs. For this graphing lesson, 4th graders create bar graphs in connection with the story, The Copycat Fish. After creating the initial graphs on paper, students use MS Excel to create graphs.
Curated OER
Do You Live a Healthy Lifestyle?
Fifth graders examine and evaluate how active their own lifestyle is by counting how many steps they take on a daily basis. They watch a PowerPoint presentation about healthy lifestyles, record how many steps they take in a day with the...
Curated OER
The M&M's Brand Chocolate Candies Counting Book
First graders use estimation skills and gather data and record their findings
Curated OER
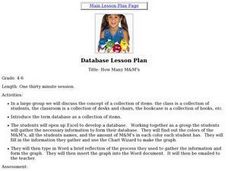
How Many M&M's
Students explore sets and collections. Students find the colors of M&M's and the amount of M&M's each student has. They organize this information into an Excel spreadsheet. Students use the chart wizard to create a graph.
Curated OER
123/ABC Hopscotch
Students practice alphabet recognition, alphabet sounds, and number readiness while playing a hopscotch type game.
Curated OER
"M&Ms"® Candies Worksheet 1
In this math worksheet, students find the likelihood of different outcomes with the use of M and M's candy for the seven questions and fill in the graphic organizer.
Starfall
Cc is for Cat
In this printing practice learning exercise, students learn to form upper and lower case letters Cc. Students trace several examples before forming their letters in the boxes.
Curated OER
Investigation - The M & M Mystery
Sixth graders inspect M&M's to complete statistical data. Students interpret percent of colors represented. They convert data from decimals, fractions, and percents. Using the data, 6th graders create a bar graph and a circle graph.
Curated OER
M&M Science and Math
A series of math and science activities feature M&M's® as manipulatives to help kids work through equations. The resource includes exercises on finding averages, percent of compositions, moles in chemical reactions, genotypes and...
Curated OER
Mental Math: Subtract Tens, Problem Solving
Subtracting by 10s is easy for your young learners with this worksheet! There are three questions to accompany a bar graph, and there's a space for learners to explain their answers. Encourage them to use mental math here!
Curated OER
AP: Chapter 15: The Chromosomal Basis of Inheritance
AP biology course-takers peer into the workings of inheritance with this worksheet. They examine the Chromosomal Theory of Inheritance, Morgan's fruit fly experimentation, and sex-linked genetic traits. Vocabulary definitions and...
Curated OER
Mmm, Mmm, M&M's
Here is another version of the classic M&M math lesson. In this one, upper graders utilize the ClarisWorks Spreadsheet program in order to document the data they come up with from their bags of M&M's. After making their initial...
Curated OER
Weather, Weather, Everywhere!
Sixth graders collect weather data to compare temperatures around the world. Using the Internet, learners collect data, put it into spreadsheets, and analyze and graph the results. An interesting way to cover the topic of weather.
Curated OER
M&M Probability
Students apply the scientific method in order to determine the probability of specific colors in a bag of M&M's. They determine the definition of probability and how it can be used. They make a hypothesis and conduct an experiment to...
Curated OER
M&Ms; Line Plots and Graphing
Students, using small individual bags of M&Ms, engage in activities including; estimating, sorting, graphing, mean, median, mode, fractions, percentage, and averaging.
Curated OER
M & M Lab
Students investigate how selection occurs in a random population. The concept is that selection affects evolution.They demonstrate how selection occurs and will analyze shifts in the populations. They design their conclusions with M...
Curated OER
Camouflage
Students observe first hand what it is like to be the prey and what he or she must do to blend in and make themselves less noticeable. They participate in a variety of hands-on activities which help them explain how insects hide...
Curated OER
Reading Chemical Formulas
Students interpret basic chemical formulas. When class begins, students interpret a "chemical formula" for fruit salad. After they interpret the recipe, students use the same strategies to identify chemical formulas. They evaluate the...
Curated OER
Statistical Calculations Using M&Ms
In this frequency worksheet, students investigate, frequency, box plots, and percentage using a package of M&Ms. Copies of the actual correspondences with the Mars company are also included.
Curated OER
Organizing Data Using Tables and Graphs
Students create graphs and tables, as well as interpret and make inferences from the data shown to determine when and where graphs and tables are most useful.
Curated OER
Chocolate Math
Students utilize chocolate to identify parts of a whole. In this fractions lesson, students discover the vocabulary associated with fractions and practice dividing a chocolate bar into pieces based on fraction problems....
Curated OER
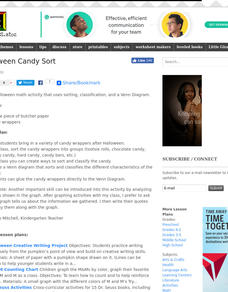
Halloween Candy Sort
Students use their Halloween candy to practice sorting and classifying. They compete a Venn diagram comparing their candy wrappers. They develop ways as a class to catorgize the candy in different ways.


