Curated OER
Count and Color M&Ms
In this counting and coloring worksheet, students observe rows with numbers and graphics of M&Ms, read the number in the first box, and count and color the correct number of M&Ms in the second box. Students color five rows of...
Curated OER
M&M’s Math Worksheet
Who knew you could cover prediction, histograms, fractions, decimals, data collection, and averages (mean, median, and mode) all with a bag of M&M's®? Here's a fantastic set of worksheets to help you make candy a mathematical journey...
Curated OER
M&Ms Count and Crunch
Middle schoolers practice skills involving statistics and probability by making predictions on number of each color candy in one pound bag of M&Ms. They record both guesses and actual quantities, calculate percentages, and create bar...
American Psychological Association
A Tasty Sample(r): Teaching about Sampling Using M&M’s
Here's a sweet activity! As part of a study of psychological research methods and statistic gathering, individuals develop a hypothesis about the number of each color of M&Ms in a fun-size package. They then count the number of each...
Curated OER
M&M's and the Scientific Method
Sixth graders explore the scientific method by conducting an in class experiment. In this scientific averages lesson, 6th graders discuss the concept of the scientific method, and define the different mathematical averages, mean, median...
Curated OER
M&M Counting Chart
Students practice classifying objects while utilizing candy. In this sorting instructional activity, students observe an assortment of M&M's and analyze the candy based on color. Students create a color chart based on the number...
Curated OER
M & M Counting Chart
Pupils create an individual M&M's graph based on the number of each color of candy pieces in their handful of candy. They graph the favorite color of the whole class while practicing counting and color identification.
Curated OER
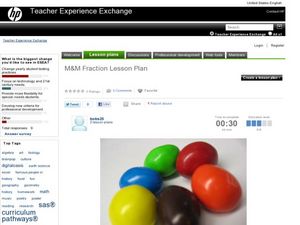
Teaching fractions & ratios with M&Ms
Students collect data using M&Ms, fill in charts, and write ratios and fractions for each color M&M.
Curated OER
Valentine M&M's Math
In this Valentine M&M's math activity worksheet, students count their M&M's, sort them by color, make a pattern with them, and create a graph showing how many of each color they have.
Curated OER
Bunny Mix M&M's Math
In this Easter M&M's math activity worksheet, students count their M&M's, sort them by color, make a pattern with them, and create a graph showing how many of each color they have.
Curated OER
Probability Using M&M's
Students estimate and then count the number of each color of M&M's in their bag. In this mathematics lesson plan, students find the experimental probability of selecting each color from the bag. Students create pictographs and bar...
Curated OER
Circle Up Your M&Ms
Fifth graders estimate how many M&Ms are in a pre-counted bag. They determine how many colored M&Ms are in a bag, then decide which of the two, bar graph or circle graph (in this case, circle graph) would be best to show te results.
Curated OER
M&M Counting Fun
Students count up to 10 or more M & Ms using verbal names and one-to-one correspondence, as well as use sets of M & Ms to represent quantities given in verbal form.
Curated OER
Mmm, Mmm, M&M's
Here is another version of the classic M&M math lesson. In this one, upper graders utilize the ClarisWorks Spreadsheet program in order to document the data they come up with from their bags of M&M's. After making their initial...
Curated OER
M & M Madness
M&M's are always a great manipulative to use when teaching math. In this graphing lesson plan, learners predict how many of each color of M & M's there are. They count up each color and plug the data into a graph using the...
Curated OER
Math: How Many Red M&Ms?
Sixth graders calculate the mean, median, and mode of candy M&Ms and find the percentage of each color. Once they complete the assignment, they compare their results with those of the candy company's percentages. As an extension,...
Curated OER
Statistics of Mars
Students explore the concept of central tendencies. In this central tendencies lesson plan, students sort M&M's or Skittles based on color. Students graph their results. Students find the mean, median, and mode of their data.
Curated OER
M&Ms; Line Plots and Graphing
Young scholars, using small individual bags of M&Ms, engage in activities including; estimating, sorting, graphing, mean, median, mode, fractions, percentage, and averaging.
Curated OER
M&M Ratios
Third graders explore ratios. In this probability lesson, 3rd graders sort and count M&M's and identify the ratios of different colors. Students use the attached worksheet as an assessment.
Curated OER
Which Color Will You Pick?
Students create a spreadsheet to chart the different colors found in a package of M&M's or Skittles. They collect data, create appropriate charts, and use percentages to describe quantities.
Curated OER
How Many? Numbers 1-5
In this numbers worksheet, learners color the correct number of M&M's that match a given number at the beginning of a row. Numbers used are 1-5.
Curated OER
Statistical Calculations Using M&Ms
In this frequency worksheet, students investigate, frequency, box plots, and percentage using a package of M&Ms. Copies of the actual correspondences with the Mars company are also included.
Curated OER
Comparing M&M's
Students sort a bag of M&M's by colors and solve a variety of comparison problems. They determine which pile of M&M's has the most, the least, and answer questions comparing two piles. Students also order the piles of M&M's...
Curated OER
Investigation - The M & M Mystery
Sixth graders inspect M&M's to complete statistical data. Students interpret percent of colors represented. They convert data from decimals, fractions, and percents. Using the data, 6th graders create a bar graph and a circle graph.


