Curated OER
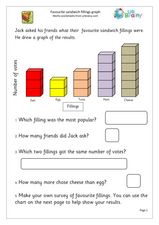
Simple Graph Activity
In this graphing worksheet, students interpret a simple bar graph of favorite sandwiches, answering 5 related questions and then conducting their own survey and creating a graph of the results.
Curated OER
Is the Rainbow Fair?
Third graders perform statistical calculations. Given a bag of Skittles, 3rd graders sort and collect data regarding the colors included in their bag. Using spreadsheet software, students create a bar graph of the information collected....
Curated OER
Graphing - Length
In this graphing worksheet, students create a bar graph showing the approximate maximum length of 12 different types of fish.
Curated OER
Math Investigations 2
Young mathematicians practice measuring and graphing skills while working in groups to measure objects found in the classroom. Using their measurements, they create one bar graph displaying the lengths and another displaying the widths.
Curated OER
Chances Are
Upper graders examine the concept of probability. They collect data and create a bar graph. They must interpret the data as well. Everyone engages in hands-on games and activities which lead them to predict possible outcomes for a...
Mixing In Math
Mixing in Math: Growing Plants
Whether you have your class plant seeds or begin when sprouts are visible, math skills are used here to predict and track growth over time. Straw bar graphs show plant height on a given day while the graph as a whole shows changes over...
Curated OER
Unit VII Energy: WS 3a Energy Transfer and Storage
Here is a nifty worksheet on energy transfer. Physics fanatics analyze a diagram and state whether or not friction is involved. They sketch bar graphs and draw energy flow diagrams for each system as well. Circular motion, movement up...
Curated OER
Graphing
Fifth graders practice using math graphs. In this graphing lesson, 5th graders work in groups to develop a topic of their own to represent as a graph. Students collect data and construct a graph for the lesson.
Curated OER
Tulip Graphing
Students create a graph of tulip growth. For this data analysis lesson, students plant tulip bulbs and use graph paper to begin graphing data on the growth of the tulip.
Curated OER
Charting and Graphing Sales
Students analyze graphs, charts and tables. For this data analysis lesson, students practice creating and analyzing charts, graphs and tables corresponding to sales and surveys. This lesson uses data relevant to students and includes...
Curated OER
Activity Plan 4-5: I'm Graphing to Know You!
Students create graphs about themselves to learn more about one another. In this early childhood math lesson, students record information about one another as they make picture graphs.
Curated OER
Tables, Charts and Graphs
Students examine a science journal to develop an understanding of graphs in science. In this data analysis lesson, students read an article from the Natural Inquirer and discuss the meaning of the included graph. Students...
Curated OER
An Immigration Graph
Students practice reading and understanding information in a table and converting the information to graph form. They create a graph showing the number of immigrants per country of origin between 1899 and 1924.
Virginia Department of Education
May I Have Fries with That?
Not all pie graphs are about pies. The class conducts a survey on favorite fast food categories in a lesson on data representation. Pupils use the results to create a circle graph.
Math Moves U
Collecting and Working with Data
Add to your collection of math resources with this extensive series of data analysis worksheets. Whether your teaching how to use frequency tables and tally charts to collect and organize data, or introducing young...
Charleston School District
Review Unit 4: Linear Functions
It's time to show what they know! An assessment review concludes a five-part series about linear functions. It covers all concepts featured throughout the unit, including linear equations, graphs, tables, and problem solving.
August House
Why Koala Has a Stumpy Tail
Learn about the animals of Australia with a language arts lesson about an Australian folktale called, Why Koala Has a Stumpy Tail. After reading the story as a class, kids discuss events and characters from the book, retell the...
Florida Center for Reading Research
Phonological Awareness - Phoneme Segmenting and Blending, Treasure Chest
Working in pairs, scholars use picture cards to practice segmenting words into phonemes and blending phonemes into words. When a peer answers correctly they place a penny in a treasure chest. Incorrect responses make the card go back in...
Missouri Department of Elementary
My Feelings
Encourage self-awareness with a lesson that challenges scholars to identify feelings—happy, sad, mad, and scared. Using a feelings thermometer, similar to that of a bar graph, pupils discuss how they would feel in specific scenarios then...
Curated OER
Graphing Memories
Mem Fox’s Wilfrid Gordon McDonald Partridge provides the labels for a graphing activity. Class members create an illustration of a memory item brought from home, and place their illustration in the proper column of a graph. When the...
Curated OER
Creating a Bar Graph with a Graphing Program
Learners use the S'COOL data base to create a bar graph.
Curated OER
Graphing Using Excel
Fifth graders complete a series of graphs by gathering information and using Excel to graph the information. In this graphing lesson, 5th graders graph favorite desserts of the class. Student put their results into the...
Curated OER
Graphing Pasta
Young scholars sort and graph various types of pasta. Using pasta construction paper patterns or real pasta, they sort the pasta by color, size, and type, and record the data on a graph.
Curated OER
Using Spreadsheets and Graphs
Third graders explore mathematics by utilizing computers. In this graphing lesson, 3rd graders gather class data based on a particular topic such as the "favorite candy" of the class. Students utilize this information and computers to...


