Curated OER
Graphing Favorite Colors
Third graders collect data and insert it into ClarisWorks to create a spreadsheet/graph of their favorite color. They interpret the data together.
Curated OER
"Living in the Limelight The Universal Dream"
Students, using Leo's Lyrics, investigate common themes in popular music. They create a Microsoft Excel spreadsheet that analyzes their findings along with a 200 word paragraph stating their observations, conclusions and hypotheses about...
Curated OER
Building Arrays Using Excel Spreadsheets
Students create arrays using Microsoft Excel. In this technology-based math lesson, students expand their knowledge of multiplication by creating arrays on the computer using a spreadsheet program such as Microsoft Excel.
Curated OER
Graphing
Young scholars gather statistical information on a chosen topic and place it into a spreadsheet. Using th Excel chart wizard, students create tables, graphs and charts of their information. They interpret the data and share it with the...
Curated OER
Finding Mean, Mode and Median in the Computer Lab
Students create spreadsheets which will display and figure mean, median, and mode of a set of numbers.
Curated OER
Create Your Geometry Crossword
Learners learn how to identify cell addresses, format cell contents, add pop-up comments to a cell, and also apply conditional formatting. They use clues and words to make a geometry crossword puzzle pertaining to geometrical shapes.
Curated OER
Spreadsheet Graphs
Students create graphs using information from spreadsheets. They select a topic from the following choices: website use, digital cameras, spreadsheets, calculators or educational software. They tally the class results and create an...
Curated OER
Using Averages to Create Graphs Through Excel
Sixth graders create and use a spreadsheet to make graphs which will be used to analyze Progress Report and Final Report Card grades. They practice finding the mean, median, mode, and range of a data set. Students also incorporate column...
Curated OER
Great Graphing
Young scholars collect data, use a computer spreadsheet program to create various graphs, and compare the graphs. They state the findings of each graph in writing and decide which graph type best represents the data.
Curated OER
The Hot Dog Stand
Students run a computer simulation. They collect data as they work and use the data to create an annual report for their business. Several different simulations could be used for this project. It is desirable for students to do this...
Curated OER
Running a Business
Middle schoolers discuss spreadsheets and how they work. They then imagine they are owners of a store, determine twenty items that they would sell, and create spreadsheets to record amounts of each item sold in a two-week period. After...
Curated OER
Home, Home in the City
Students create a spreadsheet that organizes housing information in the Houston area. They write a formula to determine the average price of homes in the Houston area.
Curated OER
Careers
Eighth graders research careers on the computer to determine which career they are interested in. They create a spreadsheet using the Excel program and calculate the budget for their desired lifestyle and determine if this income is...
Curated OER
Computer Science: Pendulum
Students investigate the basic properties of pendulums as a function of spreadsheets. Working in groups, they measure the period for a pendulum at six different lengths and record the results. They prepare a file using Microsoft Excel...
Curated OER
Create A Business and A Life
Students look through a phone book and pick a business they think they would enjoy. They brainstorm ideas about the needs of a business. They set their prices to payback their investment into the new business.
Curated OER
Skittles Candy Count
Students study how to use formulas, edit the spreadsheet, and create and edit charts. They add data to a spreadsheet, format it, add a chart and format it. They count the number of each color of Skittles and record it onto their Candy...
Curated OER
Drink It Up???
Students research and record facts about well, lake, and tap water. They increase their computer skills for research, creating a spreadsheet, and word processing.
Curated OER
Cloud Databases
Students complete a unit on clouds and a report about one type of cloud. They collect data through observation about different types of cloud cover and then create a spreadsheet to reflect their observations over a 2 week period.
Curated OER
Computer Science: Temperature
Students conduct an experiment on heat transfer and how it works. They record the temperature in whatever environment is surrounding the container and run experiments that use at least two different ambient temperatures. Students...
Curated OER
Don't Settle for a Byte... Get the Megabyte on Technology
Young scholars use word processing, presentation, and spreadsheet software. In this multi-day computer software usage lesson, students complete a research project that requires the use of a word processor, Excel, FrontPage, and...
Curated OER
Graphing Using Excel
Fifth graders complete a series of graphs by gathering information and using Excel to graph the information. In this graphing lesson plan, 5th graders graph favorite desserts of the class. Student put their results into the computer and...
Curated OER
Data! Data! Graph that Data!
Fifth graders create data graphs using Microsoft Excel. For this data collection lesson, 5th graders create and conduct a survey, then use Excel to organize and graph their data.
Curated OER
Seeing What You Cannot See--RADAR
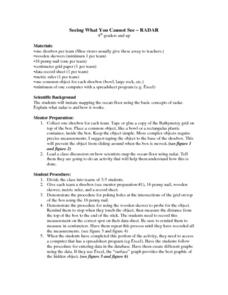
Student imitate mapping the ocean floor using the basic concepts of radar. Then they explain what radar is and how it workds. All of their measurements are recorded on a data sheet. Then the data is entered into a spreadsheet program. A...
Curated OER
Lemonade Business
Twelfth graders use all features of Microsoft Excel and Microsoft Power Point to create charts and graphs. They use charts and graphs to make a Power Point Presentation.


