Willow Tree
Histograms and Venn Diagrams
There are many different options for graphing data, which can be overwhelming even for experienced mathematcians. This time, the focus is on histograms and Venn diagrams that highlight the frequency of a range of data and overlap of...
Buffalo-Hanover Montrose Schools
Histogram Worksheet
Young mathematicians analyze a given set of numbers to complete a frequency table, and then make a histogram using the data. The worksheet includes three sets of data on the worksheet.
EngageNY
Creating a Histogram
Display data over a larger interval. The fourth segment in a 22-part unit introduces histograms and plotting data within intervals to the class. Pupils create frequency tables with predefined intervals to build histograms. They describe...
EngageNY
Describing a Distribution Displayed in a Histogram
The shape of the histogram is also relative. Learners calculate relative frequencies from frequency tables and create relative frequency histograms. The scholars compare the histograms made from frequencies to those made from relative...
Shmoop
Box, Stem-Leaf, and Histogram
A helpful and versatile activity requires young mathematicians to analyze data in order to create graphs and answer questions. Additionally, it prompts learners to find the mean, median, mode, and range of some of the data sets.
Curated OER
Make a Frequency Table and a Histogram for a Given Set of Data
In this data recording and data organization worksheet, students create one frequency table and one histogram for a given list of data. Explanations and examples for frequency tables and histograms are given.
Mathed Up!
Histograms
Class members explore how to read and use histograms by watching a video on creating and analyzing histograms. To finish, the class works on a set of questions that tests these skills.
Curated OER
Histograms
For this histograms worksheet, students solve 5 word problems based on a histogram of presidential ages at their inauguration. Next, students create a frequency table and a histogram based on a list of data which shows the average...
EngageNY
Describing Center, Variability, and Shape of a Data Distribution from a Graphical Representation
What is the typical length of a yellow perch? Pupils analyze a histogram of lengths for a sample of yellow perch from the Great Lakes. They determine which measures of center and variability are best to use based upon the shape of the...
CCSS Math Activities
Baseball Players
Statistics is an important part of baseball. Given the mean weight of players on a baseball team, scholars determine the total weight of the players. They then find the median and range of weights for the opposing team. Lastly, they...
Curated OER
Histograms and Statistical Graphics
In this statistics worksheet, students solve 6 data problems. They construct a histogram of given data, they create a frequency polygon, and a stem and leaf diagram. Students create a dot plot and a pie chart for given data sets. On the...
Curated OER
Integrated Algebra Practice: Histograms
In this histogram worksheet, students solve 6 multiple choice and short answer problems. Students read histograms and determine the frequency of a particular item.
Curated OER
Bar Graphs and Histograms
In this bar graphs and histograms activity, students create bar graphs and histograms from given information. They interpret graphs. This one-page activity contains 6 multi-step problems.
Curated OER
Counting the Stars in Draco
In this counting stars instructional activity, students construct a histogram for stars in a given star field using their apparent magnitude. Students answer 5 questions using their tabulated data and histogram to answer questions about...
Curated OER
Choose an Appropriate Graph
In this graphs worksheet, learners solve 6 fill in the blank problems where they choose the most appropriate type of graph for each set of data and explain why they chose that type. Students use bar graphs, histograms and circle graphs....
Curated OER
Analyze and Interpret Statistical Information
In this probability and statistics worksheet, 9th graders analyze and interpret histograms as they identify trends in the data. The two page worksheet contains four problems. Answers are provided.
Concord Consortium
Dubious Dice
How many ways can you slice dice distribution? A short performance task asks pupils to consider different types of distributions. Given histograms showing a triangular distribution and a bimodal distribution, they create pairs of dice...
Virginia Department of Education
Exploring Statistics
Collect and analyze data to find out something interesting about classmates. Groups devise a statistical question and collect data from their group members. Individuals then create a display of their data and calculate descriptive...
National Council of Teachers of Mathematics
Eruptions: Old Faithful Geyser
How long do we have to wait? Given several days of times between eruptions of Old Faithful, learners create a graphical representation for two days. Groups combine their data to determine an appropriate wait time between eruptions.
Curated OER
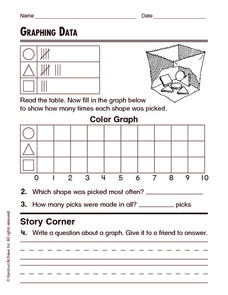
Graphing Data
In this graphing data worksheet, students solve and complete 8 different word problems related to graphing data given. First, they determine the percent of people who do not believe in any of the phenomena described and explain. Then,...
Beyond Benign
Truckin’ to Your Table
Food takes a trip to the table. Class members choose a meal from a menu and calculate the total cost of the meal including tax and tip. Using a food origin card, pupils determine how far each of the ingredients of a meal traveled to end...
Achieve
BMI Calculations
Obesity is a worldwide concern. Using survey results, learners compare local BMI statistics to celebrity BMI statistics. Scholars create box plots of the data, make observations about the shape and spread of the data, and examine the...
EngageNY
Presenting a Summary of a Statistical Project
Based upon the statistics, this is what it means. The last lesson in a series of 22 has pupils present the findings from their statistical projects. The scholars discuss the four-step process used to complete the project of their...
Georgia Department of Education
The Basketball Star
Have learners use math to prove they are sports stars! Assess a pupil's ability to create and analyze data using a variety of graphs. The class will be motivated by the association of math and basketball data.


