Northeast Arkansas Education Cooperative
Construct and Interpret a Cumulative Frequency Histogram
The finer points of telling the difference between cumulative and frequency histograms are laid out with clear examples for how to get from one to the other. From defining vocabulary through converting charted data to histogram form,...
Corbett Maths
Reading Histograms
Learn how to read and write histograms. A pair of video lessons instructs learners on the skills required to find the frequency of a range in a population from a histogram. The lesson compares a histogram to a frequency table....
Corbett Maths
Drawing Histograms
Decrease the frequency of histogram-related questions! A well-designed lesson shows how to create and read a frequency histogram using a series of three videos. Learners then complete practice problems that use the concepts shown in the...
Corbett Maths
Finding Frequencies from Histograms
Drawing and reading a histogram are two different skills. Support those having difficulty making the transition with a lesson that contains video support. Learners may view a pair of videos demonstrating how to read the frequency of a...
Corbett Maths
Drawing Cumulative Frequency Graphs
What's the difference between frequency and cumulative frequency? Young scholars consider the question as they create a cumulative frequency graph. They watch as the frequency totals grow to create a new shape of the graph.
Corbett Maths
Reading Pictograms
Let the pictures do the talking! Young scholars learn to analyze data displayed in pictograms using a video resource. They then test their analytical skills by reading and answering questions using several pictogram examples.
Khan Academy
Khan Academy: Creating a Histogram
Learn how to create histograms, which summarize data by sorting it into buckets.
Sophia Learning
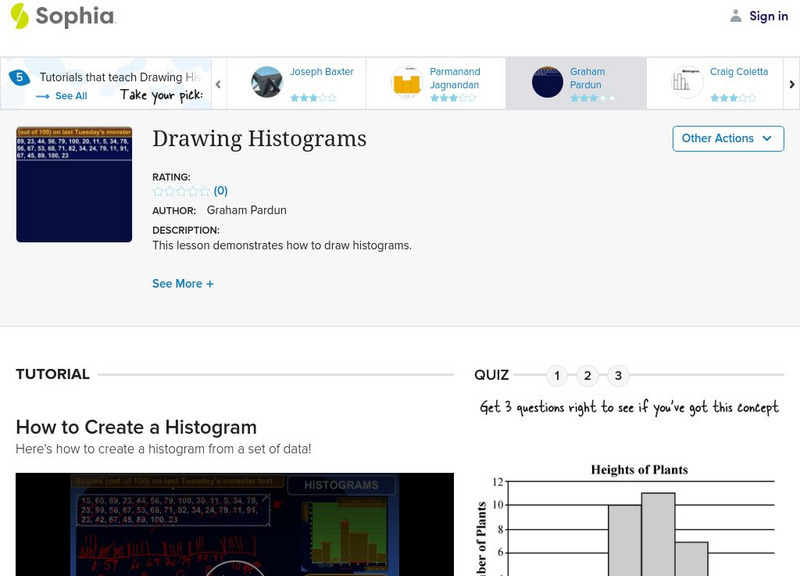
Sophia: Drawing Histograms
Given a data set, explore how to create a histogram. Complete quiz to assess understanding. [9:42]
Sophia Learning
Sophia: Drawing Histograms
This video tutorial demonstrates how to create and read a histogram.
Loyola University Chicago
Math Flix: Graphs: Bar Graph Histograms
This QuickTime movie introduces a specific type of bar graph called histograms. As you watch and listen to the teacher and student interact it helps clarify the thinking behind applying this concept.
Imagine Learning Classroom
Learn Zillion: Create a Histogram
In this lesson, you will learn how to represent data on a number line by creating a histogram. [4:44]
Khan Academy
Khan Academy: Algebra: Histograms
Video shows example of creating a histogram for data by first creating a frequency table. [6:08]
Sophia Learning
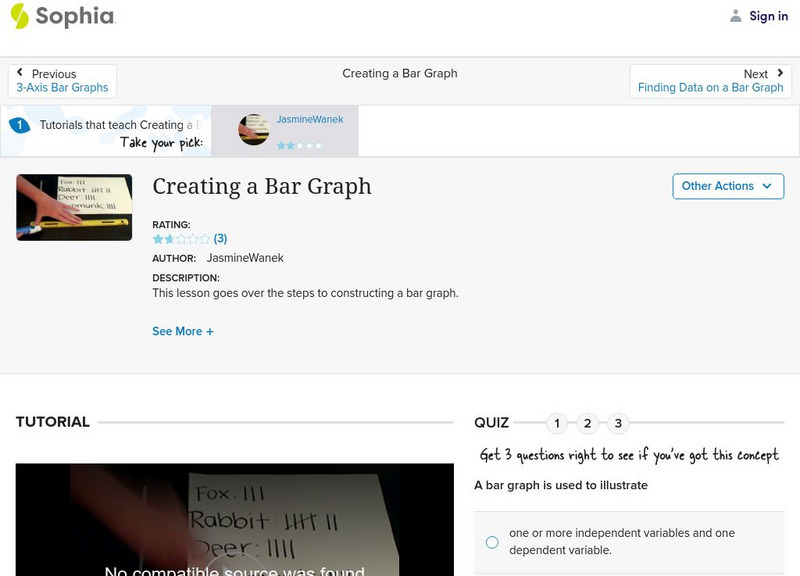
Sophia: Creating a Bar Graph: Lesson 1
This video lesson [4:41] goes over the steps to constructing a bar graph. It is 1 of 7 in the series titled "Creating a Bar Graph."
Sophia Learning
Sophia: Creating a Bar Graph
This video lesson goes over the steps to constructing a bar graph.
Loyola University Chicago
Math Flix: Graphs: Stem and Leaf Plots
This QuickTime movie provides an opportunity to create a stem and leaf plot. A pdf worksheet is available by clicking on the hyperlink at the bottom of the page. As you watch and listen to the teacher and student interact it helps...


