Radford University
Linear Equations in Real Word Problems
Make up a story about a linear graph. Scholars identify key features of a linear graph, such as intercepts, domain and range, and slope. They then create a word problem that could be represented by the graphed line.
Radford University
Snappy Stair Sprints
Let's go for a run. Small groups determine a way to collect data to determine the time it would take to run a set of stairs. After creating a plan, teams collect data and graph their results, calculating the equation of best fit and...
Curated OER
Tell Us All: Tools for Integrating Math and Engineering
What a scam! Middle and high schoolers pose as journalists exposing consumer fraud. In this lesson, they write an article for a magazine using data collected during previous investigations (prior lessons) to defend their findings that a...
EngageNY
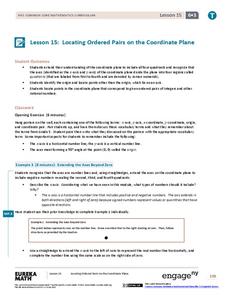
Locating Ordered Pairs on the Coordinate Plane
Four quadrants, four times the fun. Future mathematicians learn the terminology associated with the coordinate plane and how to plot points in all four quadrants. A worksheet tests their understanding of the material in the 16th...
Corbett Maths
Coordinates and Shapes
Where is the point? Given three points on the coordinate plane, the video walks through the steps to find the location of the fourth point to create a given special quadrilateral. The narrator first determines the coordinates of the...
EngageNY
Curves from Geometry
Escape to investigate hyperbolas. Pupils take a look at what happens to the elliptical orbital path of a satellite that exceeds escape velocity as the opener to the eighth lesson in a unit of 23. Scholars analyze basic hyperbolas and how...
Concord Consortium
Gestation and Longevity
Is the gestation length of an animal a predictor of the average life expectancy of that animal? Learners analyze similar data for more than 50 different animals. They choose a data display and draw conclusions from their graphs.
Mathematics Assessment Project
Sorting Equations of Circles 1
Round and round we go. Learners first complete a task on writing equations of circles. They then take part in a collaborative activity categorizing a set of equations for circles based on the radius and center.
AIMS Education Foundation
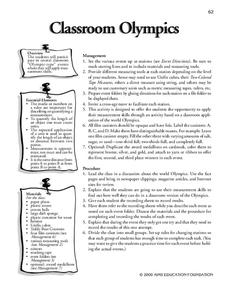
Classroom Olympics
As the Summer Olympics are approaching, incorporate Olympic-type games into the classroom. From straw javelin to cotton ball shot put, these games are sure to keep leaners engaged. The best part is that there is math involved! Pupils...
EduGAINs
Ratio and Proportion
Do these items have the same ratio? Through a learning contract, pupils master proportions by practicing proportions via word problems, graphs, and with manipulatives. An exit ticket checks for understanding at the end of the...
101 Questions
The Mystery Line
Take the mystery out of linear functions. Provided an image with no scale, learners guess where the line that connects them might cross the y-axis. After providing the coordinates of the points, they realize scale is an important...
Concord Consortium
Swimming Pool I
Take a dive into a three-dimensional task. Given a specific surface area, individuals must maximize the volume of a cylindrical swimming pool. They combine their understanding of surface area and volume to create a cubic function that...
Concord Consortium
Rectangle Space
Take a coordinated look at rectangles. The task asks pupils to plot the length and width of created triangles in the coordinate plane. Using their plots, scholars respond to questions about rectangles and their associated points on the...
Bowland
Explorers – Patrol Services
Far out — plan a trip to space! Aspiring mathematicians steer a space vehicle through an asteroid field, calculate currency exchanges to buy provisions, and determine placement of charges to blow up asteroids. Along the way, they learn...
CK-12 Foundation
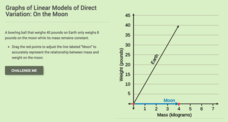
Graphs of Linear Model of Direct Variation: On the Moon
You'll be over the moon about this resource. Scholars draw a line representing the weight of an object on the moon based on its mass. Consideration of the constant of proportionality allows them to see relationships between weight of an...
Radford University
Function Family Fun
It's time for a family reunion—function families, that is. Pupils first review different types of parent functions. They then see how to apply transformations to graphs and learn how to select the most appropriate type of function to...
Curated OER
Creating and Reading a Pictograph
Second graders examine how data can be transferred into pictures on a pictograph. They analyze data on a graph about chewing gum, and create a pictograph that illustrates data about their preferences for the taste of bubble gum. ...
Curated OER
Gingerbread Man Math
Students collect and explore gingerbread man data. In this math and technology lesson plan, students examine how to organize and interpret data in three formats: objects, pictures, and graphs.
Curated OER
Graphs
Eighth graders analyze graphs on a worksheet and in newspapers and magazines. For this graphs lesson plan, 8th graders also record their thoughts in a journal.
Curated OER
Circle Graphs
Sixth graders interpret, create, and display data in a circle graph. In this circle graph lesson plan, 6th graders use a compass, protractors, pizza boxes, and more to create a circle graph and analyze the data they put into it.
Curated OER
Graphing Linear Equations
Eighth graders examine linear equations by creating graphs from them. In this graphing lesson plan, 8th graders read several linear equations and plot them on a graph with the help of their classmates. Students find the slope...
Curated OER
Temperature Bar Graph
Students explore mean, median and mode. In this math instructional activity, students analyze temperature data and figure the mean, median, and mode of the data. Students graph the data in a bar graph.
Curated OER
Picture Graphs
First graders work with picture graphs, create their own individual graphs, and construct and read graphs.
Curated OER
Favorite Candy Bar Graph
Students decide on six different types of candy bars to include in a data collection activity. Working in small groups, they survey a target group in a set amount of time. They access a Internet based graphing tool to create a bar graph...


