Curated OER
Applied Science - Science and Math Lab 4B
Learners experiment with the combination of vinegar and baking soda. In this applied science instructional activity, future scientists compare qualitative and quantitative data collected from their exploration. Then they work together to...
Curated OER
Air Pollution: What's the Solution?
This air pollution worksheet provides a step-by-step process for gathering data about the ozone and weather. Amateur meteorologists enter data for 3 days including the air quality, the temperature, the wind speed, any particular events...
Curated OER
Environmental Agents of Mathematics: Mathematics for Change
High schoolers analyze environmental science data using Math. They do research about renewable energy, gather data, create graphs and interpret their findings. Then the group presents their arguments persuasively using their findings to...
Curated OER
Bird Ecology Unit
Birds, plants, and vegetation, is there anything more lovely? There is! Engage your class in the scientific process, data collection, and data analysis. They stroll their campus observing and identifying various birds and plants,...
Curated OER
Using Your Marbles - Volume Measurement and Reporting
Demonstrate how to measure the volume of liquids and solids immersed in liquid to your class. They observe a teacher-led demonstration, and in small groups construct a data table that demonstrates how many marbles were used and the...
Curated OER
Valentine Candy Count
Here is an imaginative take on a classic lesson! Young scholars discover what color Valentine Candy is found more often than any other in a standard bag of Valentine Conversation Hearts. They observe, predict, sort, and classify the data...
Curated OER
Water Meter Reader
Junior high schoolers learn how to read a water meter, track their family water usage, and discuss the amount in class with other pupils. They will interpret real-world data and graph it. It is ideal for increasing awareness and...
Curated OER
Energy Audit
Young scholars collect data about energy usage and use mathematical calculations to analyze their data. In this energy conservation and statistics math lesson, students survey their homes to complete an energy usage worksheet. Young...
Curated OER
"Lettuce" Learn About the Water Cycle
Young scientists investigate the water cycle through a lettuce seed experiment. For this experiment, learners plant lettuce seeds inside of a ziplock bag in order to create a small greenhouse. They observe condensation and precipitation,...
Curated OER
Interpreting Data from Birdfeeders
What kinds of birds live in your area? Read a book about birds to your learners and explore their feeding patterns. Charts and graphs are provided in this three page packet, but consider assigning the basic questions if using with young...
Curated OER
Graphing and Analyzing Biome Data
Students explore biome data. In this world geography and weather data analysis lesson plan, students record data about weather conditions in North Carolina, Las Vegas, and Brazil. Students convert Fahrenheit degrees to Celsius degrees...
National Wildlife Federation
When It Rains It Pours More Drought and More Heavy Rainfall
Which is worse — drought or flooding? Neither is helpful to the environment, and both are increasing due to climate change. The 16th lesson in a series of 21 covers the average precipitation trends for two different climates within the...
Curated OER
Student News And Weather Channel
Fabulous! Your 5th graders should love this project. As an ongoing lesson throughout the year students use temperature probes to record outside temperature and then document their data using spreadsheets. They use their weather data and...
Curated OER
Independent Plant Growth Experiment
This is an awesome lesson filled with tons of engaging learning activities. Over a period of weeks learners will make observations, collect plant and analyze plant data, read and review agricultural articles, design and conduct an...
National Wildlife Federation
Wherefore Art Thou, Albedo?
In the sixth lesson in a series of 21, scholars use NASA data to graph and interpret albedo seasonally and over the course of multiple years. This allows learners to compare albedo trends to changes in sea ice with connections to the...
Beyond Benign
Medical Ethics
Just because we have the ability to determine an organism's traits through genetic testing, should we do it? Middle-school medical experts examine the ethical dilemmas in biotechnology in the 18th and final installment in a series of...
ARKive
Handling Data: African Animal Maths
Handling and processing data is a big part of what real scientists do. Provide a way for your learners to explore graphs and data related to the animals that live on the African savannah. They begin their analysis by discussing what they...
Perkins School for the Blind
The Mystery Box - Making Observations and Collecting Data
Making observations and collecting qualitative and quantitative data is a vital skill all scientists need to practice. Help your scientists with partial and no sight learn how to use their other senses to make observations for...
Office of the New Jersey State Climatologist
Play Ball! – Or Not…Making a Decision Using Weather Data
Should the game go on or not? An engaging lesson asks small groups to make a decision using weather data. After analyzing a map, an updated forecast, and radar information, groups have to decide whether to cancel a baseball game. They...
Curated OER
A Comparison Study of Water Vapor Data to Precipitation over North America
Students use NASA satellite data to compare water vapor over the United States. In this data analysis lesson students use an Excel spreadsheet to map their data.
NASA
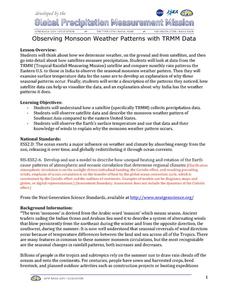
Observing Monsoon Weather Patterns with TRMM Data
Follow a fabulous slide show on how monsoons form and how satellite technology is being used to observe the phenomena, explaining why they occur. Afterward, visit the TRMM (Tropical Rainfall Measuring Mission) website to access actual...
Virginia Department of Education
Safety and the Material Safety Data Sheet
While many chemicals are used in biology class, many pupils don't understand the material safety data sheets. The lesson explains each part and the importance of understanding the forms. Young scientists use safety equipment to ensure...
US Department of Energy
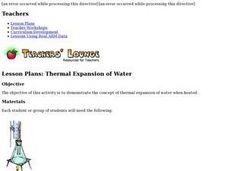
Thermal Expansion of Water: Rise of Sea Level
Using bunsen burners, Erlenmeyer flasks, thermometers, hollow glass tubes, stoppers, and rulers, learners experiment with and measure how water expands when heated. The activity connects the expansion of water when heated to global...
Curated OER
Fossil Find
Students investigate the practice of digging for fossils. They participate in a mock dig of fossils using real bones and other artifacts. Then students dig through sand in order to go through the simulation. Students make observations...
Other popular searches
- Data, Census, & Statistics
- Data Analysis Pictograph
- Data Table
- Categorical Data
- Data Analysis Lesson Plans
- Data Management
- Data Analysis Graphing
- Data Analysis and Graphs
- Science Fair Project Data
- Data Display
- Organizing Data
- Census Data


