Chicago Botanic Garden
Preparing for Project BudBurst
Adopt a plant and get to know its phenophases. The third instructional activity in a six-part series combines plant identification and phenology. Pupils begin by creating their own field guides to learn about the features and...
Chicago Botanic Garden
Preparing for Project BudBurst
Male deer growing antlers to begin the breeding season is an example of a phenological event. First in a four-part series is an activity requiring individuals to collect phenological data on their campus. Classes discuss phenology, the...
Bonneville
Solar Powered Water Pumping
Here's the perfect lesson plan for those who think the world needs faster pumps. Building on the previous activity, scholars work to make the pumps function faster in transferring water between containers. They try adding an additional...
Willow Tree
Approximating a Line of Best Fit
You may be able to see patterns visually, but mathematics quantifies them. Here learners find correlation in scatterplots and write equations to represent that relationship. They fit a line to the data, find two points on the line, and...
iCivics
Step 7: Fill the Holes
It's time to communicate without using emojis or hashtags! In the seventh step of a 10-part County Solutions - High School unit scholars analyze professional communication when accomplishing a goal. They use examples, research, and data...
American Statistical Association
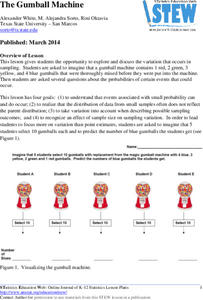
The Gumball Machine
Chew on an activity for probability. Given information on the number of gumballs in a gumball machine, scholars consider how likely it is to randomly draw a blue gumball and how many of each color they would draw in 10 trials if the...
Curated OER
Sweethearts and Data Analysis
Young scholars explore the concept collecting and representing data. In this collecting and representing data lesson, students record the different colors of sweetheart candies in their sweethearts box. Young scholars create a table of...
Curated OER
Create a Survey and Analyze the Data
Eighth graders create their survey discussing wording used in surveys and try to create one that is unbiased. They distribute the survey to the middle school but not during instructional time. They then collect and analyze the data...
Curated OER
Representing Data
Students use their math skills to solve real-world situations. In groups, they must work with data and organize it in a chart for use to make different graphs. Individually, they complete different activities and share their results with...
Curated OER
Collecting and Organizing Data
Sixth graders practice collecting and organizing data. In groups, 6th graders determine how many times "Happy Birthday" (at a reasonable rate) may be sung in ten seconds. They collect the information and create a graph.
Curated OER
Finding Equations
Students make equations from everyday data. They create a graph from the equations. Students predict and analyze the results. Students complete the second scenario on their own and turn in their handout.
Curated OER
The Race of Baseball All-Stars
Collect and analyze data. Pupils graph their data and model with it to solve real life problems. They use logic and deductive reasoning to draw conclusions.
Curated OER
Population Growth Rates
Students determine the average annual rate of change (growth rate) of U.S. national population for each decade of historical census data.
Curated OER
How Do You Read Stock Quotes Online ?
Students explore how to get and interpret stock price data online. They also describe certain aspects of various corporations and know the meanings of important terms involving the stock market.
Curated OER
Exploring Biomes Lesson 3: Endangered Biomes
Future environmental scientists compare data from two different conservation strategies. Alone this lesson is sufficient, but as part of the Exploring Biomes unit produced by the Arizona Fish and Game Department, it becomes top-notch.
Curated OER
On the Trail of the Hudson's Migratory Fish
Using data related to the fish in the Hudson River area, learners calculate distance, elapsed time, and growth. They learn about migratory fish, the life cycle of a fish, analyze a map, and answer questions.
Curated OER
Graphing Memories
Mem Fox’s Wilfrid Gordon McDonald Partridge provides the labels for a graphing activity. Class members create an illustration of a memory item brought from home, and place their illustration in the proper column of a graph. When the...
Curated OER
Simplified Vertical Rebound Testing
Students participate in a lab activity in which they examine a simple energy transformation system. Students test the rebound of elastomers, produce rebound data, and determine the kinetic energy transformed by the impact of a free...
Curated OER
Sports Teams & Math
Students collect sports data, keep track of wiins, losses and scores and average the teams' scores.
Curated OER
Lead and Mercury: Comparing Two Environmental Evils
High schoolers in chemistry or health courses look at the material safety data sheet (MSDS) and periodic table of elements to gather information about mercury and lead, two toxic materials that have been found in food products. They read...
Curated OER
Give Me A Break!
Students create and conduct a survey. In this broken bones lesson, students discuss if they've ever broken a bone and how a broken bone heals. Students generate questions for a survey on broken bones and healing time, conduct the survey...
Curated OER
Using Primary Source Documents in the Classroom
Students use primary documents to explore the past. They consider the source of the documents and identify and biases that the author may have held. They identify any questions about the historical event that may remain after reading the...
Curated OER
Price of Apples- Linear Data
Students collect data and create a graph. In this algebra lesson, students describe functions graphically, algebraically and verbally. They identify functions as being independent and dependent using variables.
Curated OER
Beginning Modeling for Linear and Quadratic Data
Students create models to represent both linear and quadratic equations. In this algebra lesson, students collect data from the real world and analyze it. They graph and differentiate between the two types.
Other popular searches
- Data, Census, & Statistics
- Data Analysis Pictograph
- Data Table
- Categorical Data
- Data Analysis Lesson Plans
- Data Management
- Data Analysis Graphing
- Data Analysis and Graphs
- Science Fair Project Data
- Data Display
- Organizing Data
- Census Data


