Curated OER
Graphing Linear Equations Using Data Tables
Students review the Cartesian plane and the process of plotting points. In groups, students create tables, identify the slope and y-intercept, and graph the equation. Afterward, students perform the same process, only, individually. As a...
Curated OER
Plotting the Ocean Floor
Fourth graders plot points on a graph, connect the dots to make the ocean floor profile and label the topographical features. They utilize a worksheet and a website imbedded in this plan to plot the ocean floor.
Curated OER
Get In Line!
Students compare and order fractions and decimals using a number line. They use rules of conversion to determine equivalencies competing problems accurately and plot points on the number line that represent the correct order of the...
Curated OER
Scientific Observation of Force and Acceleration on an Object
In this force and acceleration worksheet, 8th graders answer ten questions based on two graphs. The first graph is a scatter plot, the second is a line graph.
Curated OER
Forces and Graphing
Learners analyze graphs to determine relationships between variables and rates of change. They determine the basic concepts about static reaction forces. They determine the slope and equation of a line.
Curated OER
The Spectrum of a Star
Tenth graders identify stars based on their line spectra. In this astronomy lesson, 10th graders analyze spectrograph and determine the elements present in the star. They explain the relationship between temperature and star classes.
Curated OER
The Human Population
In this human population worksheet, students are given data about the size of the human population from the 1800s to 1999. They plot the data and answer critical thinking questions about the changes in human population.
Curated OER
Cities
Students examine U.S. Census figures. In this urban centers lesson, students compare city populations across the span of 50 years. Students create line graphs based on the data.
Curated OER
Boyle's Law Lab
In this gas lab, students use a pressurized soda bottle with a closed end syringe to simulate Boyle's Law. They alter the volume and watch the effects on the pressure of the gas. They plot their data and answer eight post lab questions.
Curated OER
Areas Under Curves: An Astronomical Perspective
In this area under the curve worksheet, students use a graph of the number of exoplanets discovered and the year they were discovered to solve 5 problems. Students find the total area under the curve, they find the total number of...
Curated OER
The Graduation Dilemma
Ninth graders explore data analysis. For this Algebra I lesson, 9th graders collect and organize data to create a scatter plot. Students use the regression feature of the calculator to find the line of best fit and use the...
Curated OER
Line Graph
In this math instructional activity, students look for the data to fill the line graph. They plot the data using the x and y axis to represent the correct categories.
Curated OER
Chart the Stars
Seventh graders find constellation distances and plot the stars. For this star lesson, 7th graders plot the star points for Canis Major. Students use graphing calculators to graph the constellation. Students choose another constellation...
Statistics Education Web
Sampling in Archaeology
Compare different random sampling types using an archaeological setting. Scholars collect data from an archaeological plot using simple random samples, stratified random samples, systematic random samples, and cluster random samples....
Mathematics Assessment Project
Middle School Mathematics Test 3
Real-life mathematics is not as simple as repeating a set of steps; pupils must mentally go through a process to come to their conclusions. Teach learners to read, analyze, and create a plan for solving a problem situation. The...
College Board
2005 AP® Statistics Free-Response Questions Form B
Here's another great way to learn from the past. Released free-response questions provide a look into how concepts measured on the 2005 AP® Statistics Exam on Form B. Teachers and pupils review questions that cover concepts such as...
College Board
2007 AP® Statistics Free-Response Questions Form B
So that is how they do it! Pupils and teachers see how College Board assesses topics using the free-response questions from Form B of the 2007 AP® Statistics test. The six questions are divided in two sections, the first five being...
Curated OER
Walking the Plank: Student Worksheet
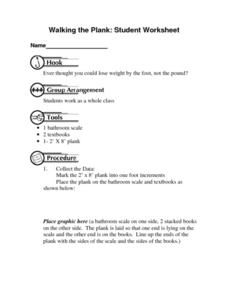
In this math worksheet, students will work in a group to experiment with the weight of objects when placed at a distance from a scale (using a plank). Students will record and graph their results.
Curated OER
The Apple Orchard Problem
Students explore various approaches to solving a problem of maximizing the total production of apples in an orchard. In this apple orchard instructional activity, students collect data in order to solve the apple orchard problem...
Curated OER
Plate Tectonics
Students simulate the three types of plate boundaries using robots. In this earth science lesson, students explain how earthquakes and volcanoes are formed. They collect real-world earthquake data and plot them on the map.
Curated OER
Plate Patterns
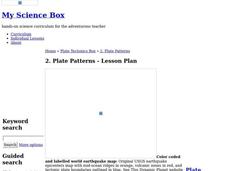
Learners review the patterns they discovered from a previous activity. In this investigative lesson students plot data as a class and color a map.
Curated OER
Black Out
Students collect and analyze data. In this statistics lesson, students plot their data on a coordinate plane and find the line of best fit. They calculate the linear regression using the data.
Curated OER
Lesson Plan On Fran Data
Seventh graders investigate the concept of functions and how they are used in the context of the real world while identifying the dependent and independent variables. They graph relations and functions and find the zeros of functions....
Curated OER
Graph it!
Sixth graders view a Stacked Graph, and discuss what it shows. Students discuss the basics of graphing: labels, intervals, legends x and y axis... Students create individual stacked graphs from provided information. Students view a...

