Curated OER
Barbie Bungee
Middle and high schoolers collect and analyze their data. For this statistics lesson, pupils analyze graphs for linear regression as they discuss the relationship of the function to the number of rubber bands and the distance of the...
Curated OER
A Closer look at Oil and Energy Consumption
Upper graders analyze basic concepts about the consumption, importation and exportation of the worlds oil production. They create several graphs to organize the data and draw conclusions about the overall use of oil in the world.
Curated OER
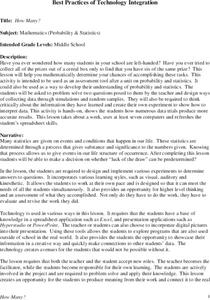
How Many?
Middle schoolers explore and design ways to collect data through simulations and random samples. They perform two experiments to determine the answers to various probability problems, and present the data/graphs in the form of a...
Curated OER
Vacation Values: A Math WebQuest
Fifth graders participate in a Math Web Quest to research two vacation options for their "families" in order to determine the best mathematical value for their family. They gather data, create two comparison graphs based on that data,...
Shodor Education Foundation
Algorithm Discovery with Venn Diagrams
Here is a lesson that takes an interesting approach to analyzing data using box and whisker plots. By using an applet that dynamically generates Venn diagrams, the class forms a strategy/algorithm for guessing the rule that fits...
EngageNY
Relationships Between Two Numerical Variables
Is there another way to view whether the data is linear or not? Class members work alone and in pairs to create scatter plots in order to determine whether there is a linear pattern or not. The exit ticket provides a quick way to...
University of Colorado
The Moons of Jupiter
Middle schoolers analyze given data on density and diameter of objects in space by graphing the data and then discussing their findings. This ninth installment of a 22-part series emphasizes the Galilean moons as compared to other...
Curated OER
TE Activity: A Tornado in My State?
Students study data about tornadoes in the United States while completing a worksheet. They develop a bar graph showing the number of tornadoes for the top ten states in the US. They find the median and mode of the data set.
Laboratory for Atmospheric and Space Physics
The Planets and Scale
Scholars gain an insight into the relative size of planets and distance between inner and outer planets with the help of informational text, a data table, and a series of four questions.
National Wildlife Federation
Lights, Camera, Action! Conducting an Energy Audit
Thirty percent of energy used by schools is used inefficiently! Part two in the series of 12 has groups perform energy audits of their schools as part of the Cool Schools Challenge. Each group is assigned a specific room, performs the...
Curated OER
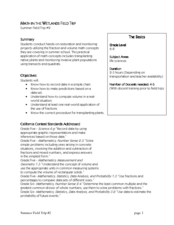
Math in the Wetlands Field Trip
Get your class out in the environment for hands on math activities. In this wetlands lesson, learners transplant native plants, calculate how much soil is needed, and perform math activities based on this experience. They then make...
American Statistical Association
A Sweet Task
Candy is always an effective motivator! A fun math activity uses M&M's and Skittles to explore two-way frequency tables and conditional probability. The candy can serve a dual purpose as manipulatives and experimental data.
Curated OER
Sky Observations Sky & Cloud Windows
Students observe the sky and weather to gather data. They conduct experiments to answer questions about the sky and weather phenomena. They measure, analyze and present data. They create sky windows by gluing sky colored paint chips...
Virginia Department of Education
Quadratic Curve of Best Fit
Class members create a table of the number of chords that can be drawn given the number of points on a circle. Pupils analyze the data created, find a function to fit to it, and use the function to make further predictions.
Virginia Department of Education
Exponential Modeling
Investigate exponential growth and decay. A set of six activities has pupils collecting and researching data in a variety of situations involving exponential relationships. They model these situations with exponential functions and solve...
National Council of Teachers of Mathematics
National Debt and Wars
Take a functional approach to the national debt. Learners collect information about the national debt by decade and plot the data. They determine whether an exponential curve is a good fit for the data by comparing the percent changes...
Curated OER
Nutrition and Food Security
Examine the three basic nutrients and their effects on the body. Fifth graders will research data to construct a bar graph and then demonstrate the relationship between malnutrition and food security. This is a very comprehensive...
EngageNY
Ruling Out Chance (part 1)
What are the chances? Teach your classes to answer this question using mathematics. The first part of a three-day instructional activity on determining significance differences in experimental data prompts learners to analyze the...
Rochester Institue of Technology
Ergonomic Design
To an engineer, the glass is never half full; it's just double the necessary size. The fifth installment of a nine-part technology and engineering series teaches pupils about the idea of ergonomic design. Measurements of popliteal height...
American Statistical Association
What is the Probability of “Pigging Out”
Learners apply their understanding of luck to a probability experiment. They play a game of Pass the Pigs to determine the probability of a specific outcome. Using analysis for their data, pupils declare the measures of center, dot...
US Environmental Protection Agency
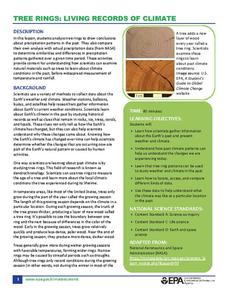
Tree Rings: Living Records of Climate
Open with a discussion on weather and climate and then explain how tree rings can provide scientists with information about the earth's past climate. Pupils analyze graphics of simulated tree rings from various US locations for the...
Curated OER
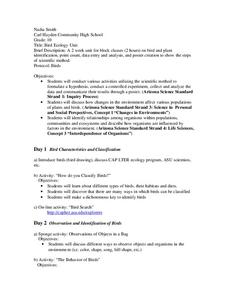
Bird Ecology Unit
Tenth graders conduct various activities utilizing the scientific method to formulate a hypothesis, conduct a controlled experiment, collect and analyze the data and communicate their results through a poster. They also identify...
Curated OER
Questioning NASA
Space science and math collide in this inquiry that investigates launching times for antacid-tablet rockets! Upper elementary or middle school learners collect data as they launch these mini rockets. They apply concepts of place value...
NOAA
Biological Oceanographic Investigations – Keep Away
As of 2015, there are 53,481 oil wells in the Gulf of Mexico. Scholars determine how species diversity is impacted based on the ecosystem's distance from a drilling platform. It focuses on finding the mean of data sets...
Other popular searches
- Collecting and Recording Data
- Collecting and Organizing Data
- Collecting and Graphing Data
- Collecting and Using Data
- Games on Data Collecting
- Collecting Weather Data
- Collecting and Comparing Data
- Patterns Data Collecting
- Math Data Collecting
- Patterns, Data Collecting
- Collecting and Charting Data
- Patterns\, Data Collecting


