Radford University
Are We Normal?
Develop a sense of normal. Learners develop two questions to ask classmates to gather numerical data before creating a box and whisker plot and a histogram to display their data. Class members make inferences and investigate the data...
Worksheet Place
How I Get to School
Find out how many of your learners take the bus, how many walk, and how many bike with a quick survey. Class members gather data about how each individual gets to school and mark the results on this page in order to create a bar graph.
Virginia Department of Education
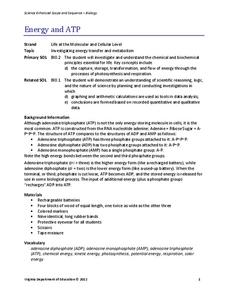
Energy and ATP
Take charge of your biology class by using this exciting analogy to relate the ATP process with batteries. Pupils use batteries and rubber bands to simulate the phosphate bonds between molecules in the body. They measure the distance in...
Carolina K-12
The Results are In! Examining Our First Vote Election
The 2016 election is over, and now it's time to dig in to some data! An activity revolves around data gathered from the First Vote Project in North Carolina wherein thousands of students voted. After diving in to the data using...
Curated OER
Lesson Plan Outline for Rainbow Science
Young scientists study light reflection and refraction as they determine the critical angle, the rainbow angle, and color separation in rainbows. Teams record the data they collect in a shared spreadsheet and discuss results with the class.
Wind Wise Education
What are Wind Shear and Turbulence?
Let's go fly a kite. By flying a kite, class members observe the difference in air flow. The class notices the characteristics of banners tied to the kite string to determine where wind turbulence stops. Adding an anemometer to...
Virginia Department of Education
Electricity and Magnetism
Take charge of your class and provide them with an electrical experience! Individuals investigate the basic principles of electricity and magnetism by creating a model to test electric current and the amount of electricity generated....
University of Colorado
The Jovian System: A Scale Model
Jupiter has 67 moons! As the seventh in a series of 22, the exercise shows learners the size and scale of Jupiter and its Galilean moons through a model. They then arrange the model to show how probes orbited and gathered data.
American Psychological Association
Do Cookies/Donuts Improve Memory? Errors in Methodology
If the methodology is skewed, the results will be skewed. That's the takeaway from an exercise designed to get class members thinking about research methods and statistics gathering. Instructors manipulate the testing environment to...
5280 Math
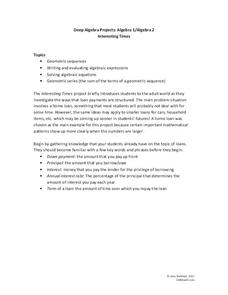
Interesting Times
Gain a little interest in functions with a real-life task. Young scholars analyze home loan data with a geometric sequence and series. They use the models to make predictions about the total loan payments at certain intervals in a...
Chymist
Ink Analysis: An Experiment in Paper Chromatography
Test differences in writing instruments with this hands-on activity to demonstrate paper chromatography in action. The class performs an experiment on multiple writing instruments and determines the area of separation to discover an...
Committee for Children
Students Learn to Stop Rumors Before They Start
Two activities look at how rumors are spread and ways class members can stop them. The first activity brings forth an in-depth conversation about how reporters gather information to write articles and how students can implement the same...
Curated OER
Introduction to Graphs
Learners poll classmates to gather information for a graph. They identify three types of graphs (bar, line, table). Students create each type of graph using data gathered from classmates.
Curated OER
Earthquake Epicenter
Students use chart data to determine the location of the epicenter of an earthquake. This task assesses students' abilities to generalize and infer, organize data, interpret data, and apply mathematical concepts.
Curated OER
Weather
Students create a spreadsheet and chart using data collected. In this weather instructional activity, students select five cities from their state, including the city they live in. Students take daily temperature readings...
Curated OER
Create Your Own Form
Students gather and organize data using a mock census form, and determine mean, mode, range, and median for sets of data.
Curated OER
The Numbers Tell the Story
Students demonstrate how to gather and interpret statistical data. In this data analysis instructional activity, students search for statistics on the health effects of smoking and place the information into charts. Students create these...
Curated OER
Atlatl Lessons Grades 4-12: Lesson for Beginning Users of Atlatl
Sixth graders determine the mean, range median and mode of a set of numbers and display them. In this data instructional activity students form a set of data and use computer spreadsheet to display the information. They extend of...
Curated OER
Lessons for Atlatl Users with Some Experience-Grade 6
Sixth graders experiment with an atlatl and dart. In this sixth grade data management mathematics lesson plan, 6th graders explore and determine the most suitable methods of displaying data collected from their experimentation with...
Curated OER
Favorite Days
Students collect and organize data about themselves. In this data analysis instructional activity, students discuss their favorite calendar dates and explore ways to display the data.
Curated OER
If Our Class Went to See the Prince
First graders read the story One Monday Morning and create picture graphs based on the number of teachers, boys, and girls that would visit the prince. In this data lesson plan, 1st graders interpret tables and graphs with the help of...
Curated OER
Reading the Neighborhood
First graders complete activities with the story One Monday Morning in the Macmillan/McGraw Hill Textbook. In this data lesson, 1st graders read the story and gather data to create a picture graph. They read the graph and answer...
Curated OER
M & M Madness
Students work with the mathematics unit of collection, organization, and presentation of data. In this math and technology lesson plan, students use Valentine M & M’s and The Graph Club to sort and graph the various colored M & M’s.
Curated OER
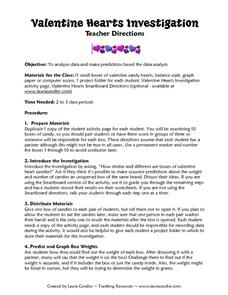
Valentine Hearts Investigation
Students practice analyzing data and making predictions. In this 2nd - 3rd grade lesson plan, students investigate and compare data gathered using boxes of valentine candy hearts. Students examine the different boxes of candy provided,...
Other popular searches
- Data Gathering
- Science Data Gathering
- Data Gathering Strategies
- Gather and Organizing Data
- Gather and Organize Data
- Gathering Qualitative Data
- Data Gathering Tests
- Gathering and Charting Data
- Math Data Gathering
- Math, Data Gathering
- Gather Solar System Data
- Gathering Weather Data


